Fat Quality of finishing pigs
Meta-analyses Describing the Variables that Influence the Backfat, Belly Fat, and Jowl Fat Iodine Value of Pork Carcasses
Published: April 25, 2011
By: J. R. Bergstrom, M. D. Tokach, J. L. Nelssen, S. S. Dritz (Kansas State University), R. D. Goodband, J. M. DeRouchey, and T. A. Houser
Summary
Concern about the quality of pork fat has increased in the United States over the last decade, largely because of the increased availability and use of dried distillers grains with solubles (DDGS) in swine diets. The iodine value (IV) of pork fat is commonly used as an indicator of quality. To identify the factors associated with carcass fat IV, meta-analyses were conducted to describe the relevant variables and to develop prediction equations to assist swine nutritionists and producers in producing pork fat with an acceptable IV. Data from 21 experiments were used to develop prediction equations for carcass fat IV of pigs fed a relatively constant dietary iodine value product (IVP) throughout the feeding period, and 6 experiments were used to develop prediction equations for carcass fat IV of pigs fed a dietary IVP-reduction strategy before marketing. Backfat, belly fat, and jowl fat IV were all highly correlated among the experiments that measured the IV of the multiple fat depots (r ≥ 0.880; P < 0.001). As expected, the dietary concentrations of unsaturated (primarily polyunsaturated) fatty acids were the most important in predicting carcass fat IV. However, improved prediction models were achieved by including variables to describe the pigs' initial and final BW, ADG, and carcass leanness. Increased ADG, final BW, BW range over course of the diet, and backfat depth resulted in reduced backfat IV (P < 0.02). Belly fat IV was also reduced with increasing final BW, BW range over course of the diet, and backfat depth (P < 0.03). A reduced jowl fat IV was associated with an increase in backfat depth and a lower fat-free lean index (FFLI, P < 0.02). Data analyzed to develop equations for predicting carcass fat IV using a dietary IVP-reduction strategy indicated that the concentrations of dietary polyunsaturated fatty acids in the initial diet were the most important. The concentrations of dietary polyunsaturated fatty acids in the reducedIVP diet fed before marketing were also important in predicting the IV of carcass fat. However, the IV of backfat was the most amenable to change using an IVP-reduction strategy. Feeding the pigs for a longer period and to a heavier final BW resulted in a reduced backfat IV (P ≤ 0.05). These results indicate that, although primarily determined by dietary factors, an understanding of the other variables that influence the IV of pork fat is necessary to reduce the likelihood of concerns with pork fat quality.
Key words: fat quality, fatty acids, iodine value, prediction equation
Introduction
Attention to the quality of pork fat has increased in the United States over the last decade, largely because of greater availability and use of dried distillers grains with solubles (DDGS) in swine diets. Feeding 10 to 30% or more DDGS may not affect carcass lean characteristics, but results in an increase in unsaturated carcass fat and the likelihood of soft bellies (Whitney et al., 2006 2 ). Recent economic circumstances have encouraged pork producers to feed greater concentrations of DDGS, despite anticipated reductions in growth performance. As a result, some processors have become increasingly involved in the feeding practices employed by pork producers. Iodine value (IV) is currently utilized as a standard indicator of carcass-fat quality in the United States. It provides an overall estimate of the unsaturated fatty acid content (greater IV = greater unsaturated fatty acid concentration), and it serves as an indicator of the fat firmness (greater IV = softer fat) and risk for rancidity (greater IV = increased risk of rancidity). However, carcass-fat quality standards can vary considerably. Various thresholds for backfat IV have ranged from 60 (Hugo & Roodt, 2007 3 ) to 74 (Boyd et al., 1997 4). Currently, one U.S. processor (Triumph Foods, St. Joseph, MO) routinely samples carcass jowl fat for IV and has established a threshold of 73. However, the IV of pork fat differs according to anatomical location, with the IV of jowl fat generally being greater than that of backfat (Benz et al., 2008 5).
Therefore, meta-analyses were conducted to determine (1) the effects of dietary fatty acids (or dietary IVP) and variables associated with growth and carcass characteristics on the backfat, belly fat, and jowl fat fatty acids (or IV) and (2) the effects of dietary fatty acid (or IVP)- reduction strategies on the backfat, belly fat, and jowl fat fatty acids (or IV). The data for the first objective were utilized to develop equations to improve our ability to predict backfat, belly fat, and jowl fat IV. Data for the second objective were used to develop equations to improve our ability to use IVP-reduction strategies to meet acceptable fat-quality standards.
Procedures
Data Selection
The data used for the meta-analyses were obtained from numerous sources. A comprehensive search for published data was conducted via the Kansas State University (K-State) Libraries, using the Internet and the ISI Web of Knowledge/CABI search engine. Additional data were obtained through communication with authors affiliated with their studies. Data from both refereed and non-refereed publications, such as theses, technical memos, and university publications, were included.
Data interpretation
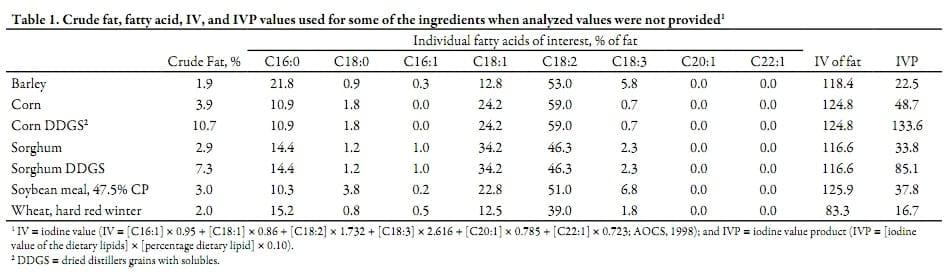
The IVP of every treatment diet was calculated as [IV of the dietary lipids] × [percentage dietary lipid] × 0.10, even when already reported, to ensure a uniform interpretation of dietary IVP across experiments. The IV of the lipid fraction of the dietary ingredients was calculated with the American Oil Chemists' Society (AOCS 1998) equation (IV = [C16:1] × 0.95 + [C18:1] × 0.86 + [C18:2] × 1.732 + [C18:3] × 2.616 +[C20:1] × 0.785 + [C22:1] × 0.723), using either the published fatty acid values for added fat sources (NRC, 1998 6) or the analyzed profiles of the diet or diet components when reported. When analyzed values for the fat or fatty acid content were not provided for corn and soybean-based ingredients, the fatty acid profiles were calculated by using the NRC (1986) values for their fat content and the fatty acid profiles from corn oil and soybean oil (Table 1).
For treatments applied over more than one dietary phase to achieve a desired IVP or dietary fatty acid treatment, the mean IVP, mean content of fatty acids, mean ME density, and the mean percentage of dietary ME from fat of the diets were used to describe the treatment applied.
The analyzed fatty acid composition of backfat, belly fat, and jowl fat were used to calculate their IV with the AOCS (1998) equation (IV = [C16:1] × 0.95 + [C18:1] × 0.86 + [C18:2] × 1.732 + [C18:3] × 2.616 + [C20:1] × 0.785 + [C22:1] × 0.723) when the IV was not already reported using this equation.
Overall, 21 experiments were used to develop models for predicting the backfat, belly fat, or jowl fat IV of pigs fed a relatively constant IVP throughout the feeding period. For the analysis of IVP-reduction strategies, 6 experiments were used for modeling the backfat, belly fat, or jowl fat IV.
Statistical analyses
Each dietary IVP-treatment strategy applied within each study was considered the experimental unit (or observation) for modeling the effects of diet, duration, growth, and carcass fat/lean characteristics on backfat, belly fat, and jowl fat IV. The specific variables of interest included in the data were the experiment, genetic line, gender, dietary treatment IVP, grain source(s), protein source(s), added fat source(s), average caloric density (ME, kcal/kg), average C16:0 (%), average C18:0 (%), average C16:1+C18:1 (%), average C18:2 (%), average C18:3 (%), diet ME from fat (%), initial BW (kg), total duration (d), ADG (kg), ending BW (kg), BW range (ending BW - initial BW, kg), HCW (kg), backfat depth (mm), FFLI, and backfat IV, belly fat IV, and/or jowl fat IV.
For the meta-analysis of IVP-reduction strategies, the same dietary variables of interest were used for the diet fed during the period of reduced IVP. The total duration of the feeding period was also divided into the number of pre-reduction and actual reduction days. Interim BW was also included for the reduction analysis, and the BW range during the pre-reduction and actual reduction periods were included. An additional variable was created for the IVP-reduction analyses by multiplying the dietary IVP fed during the reduction period by the number of days in the period. This was necessary to describe the combined effect of the reduced IVP and duration that it was fed. All other variables remained the same as the previous meta-analysis of pigs fed a constant IVP.
The data for both meta-analyses were analyzed using the correlation, general linear models, and regression procedures of the SAS (SAS Institute, Inc., Cary, NC). The correlation procedure was used to indicate the significance of the relationship of each independent variable to the backfat IV, belly fat IV, and jowl fat IV, and to identify the significance of the relationship of IV among the 3 fat depots. The general linear models procedure was used to test the variables for significant interactions, and the regression procedure was used to develop prediction equations for backfat, belly fat, and jowl fat IV using a stepwise approach. The models were first developed without using the dummy variables for gender. Intercept-adjusted collinearity diagnostics (using the SAS syntax = COLLINOINT) and variance inflation factor (SAS syntax = VIF) were used to assist with the identification of variables with collinearity. Pairwise collinearity of variables was indicated by a condition index of ≥ 30 or a variance inflation of ≥ 10. When 2 variables were found to be collinear, the variable that provided the greatest R2 was kept in the model, and the other variable was excluded. Additionally, plots of the residuals were examined to identify influential observations, but no observations were identified and removed for introducing bias into the models. Lastly, the dummy variables were tested with the final models to evaluate the influence of gender on backfat IV, belly fat IV, and jowl fat IV. Overall, correlations, interactions, variables, and models were considered significant at P < 0.05.
Results
Meta-analyses of experiments with treatments consisting of a continuous IVP throughout the feeding period
Correlations
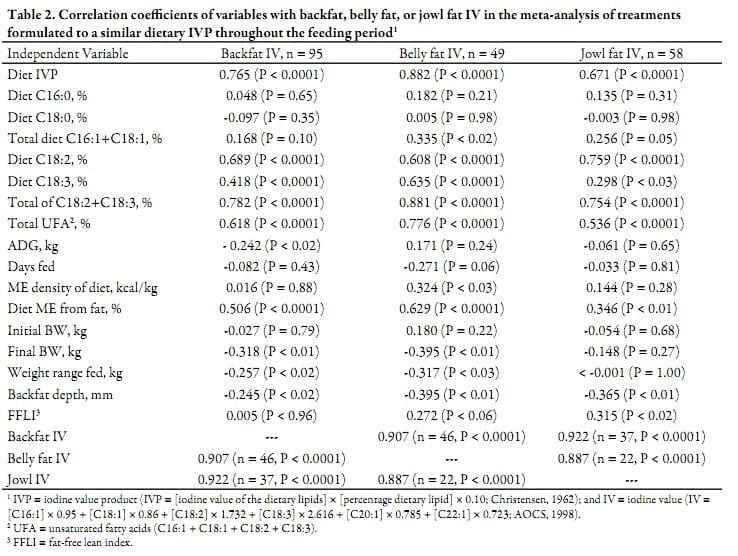
Backfat, belly fat, and jowl fat IV were all highly correlated (r ≥ 0.887; P < 0.0001) to each other (Table 2). Dietary characteristics had the highest correlations with the carcass backfat, belly fat, and jowl fat IV. For backfat IV, the total dietary concentration of C18:2 and C18:3 had the highest correlation (r = 0.782; P < 0.0001); followed by the diet IVP (r =0.765; P < 0.0001), dietary concentration of C18:2 (r = 0.689; P < 0.0001), total dietary concentration of the unsaturated fatty acids C16:1, C18:1, C18:2, and C18:3 (r = 0.618; P < 0.0001), percentage of the diet ME from fat (r = 0.506; P < 0.0001), and dietary concentration of C18:3 (r = 0.418; P < 0.0001). For belly fat IV, the diet IVP had the highest correlation (r = 0.882; P < 0.0001); followed by the total dietary concentration of C18:2 and C18:3 (r = 0.881; P < 0.0001), total dietary concentration of the unsaturated fatty acids C16:1, C18:1, C18:2, and C18:3 (r = 0.776; P < 0.0001), dietary concentration of C18:3 (r = 0.635; P < 0.0001), percentage of the diet ME from fat (r = 0.629; P < 0.0001), dietary concentration of C18:2 (r = 0.608; P < 0.0001), total dietary concentration of C16:1 and C18:1 (r = 0.335; P < 0.02), and the ME density of the diet (r = 0.324; P < 0.03). For jowl fat IV, the dietary concentration of C18:2 had the highest correlation (r = 0.759; P < 0.0001), followed by the total dietary concentration of C18:2 and C18:3 (r = 0.754; P < 0.0001), diet IVP (r = 0.671; P < 0.0001), total dietary concentration of the unsaturated fatty acids C16:1, C18:1, C18:2, and C18:3 (r = 0.536; P < 0.0001), percentage of the diet ME from fat (r = 0.346; P < 0.01), dietary concentration of C18:3 (r = 0.298; P < 0.03), and total dietary concentration of C16:1 and C18:1 (r = 0.256; P = 0.05).
As expected, growth and/or carcass variables were also found to be significantly correlated with backfat, belly fat, and jowl fat IV. For backfat IV, the ending BW had the highest negative correlation (r = -0.318; P < 0.01), followed by the weight range fed (r = -0.257; P < 0.02), backfat depth (r = -0.245; P < 0.02), and ADG (r = -0.242; P < 0.02). For belly fat IV, the ending BW and backfat depth had the highest negative correlation (r = -0.395; P < 0.01), followed by the weight range fed (r = -0.317; P < 0.03), with trends (P ≤ 0.06) for a negative correlation for days fed (r = -0.271) and a
positive correlation for FFLI (r = 0.272). Jowl IV was negatively correlated with backfat depth (r = -0.365; P < 0.01) and positively correlated with FFLI (r = 0.315; P < 0.02).
Prediction equations
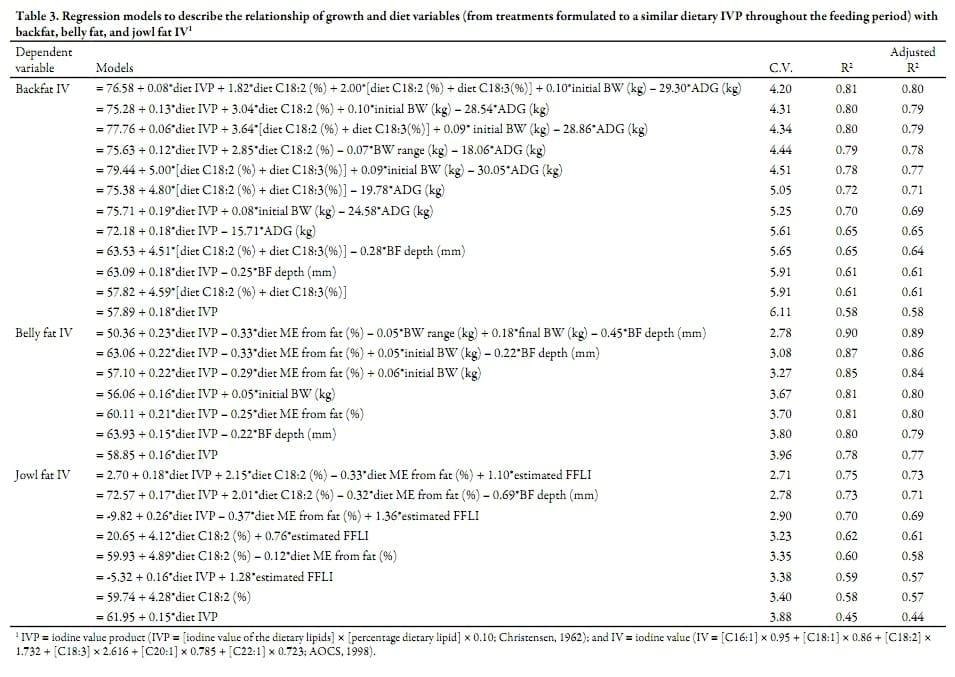
The regression analyses of dietary and growth characteristics resulted in equations to predict backfat, belly fat, and jowl fat IV (Table 3). Equations using a single predictor demonstrated the primary influence of dietary unsaturated fatty acids on the IV of pork fat. However, improved equations were obtained by including multiple variables to describe the diet, animals, and growth.
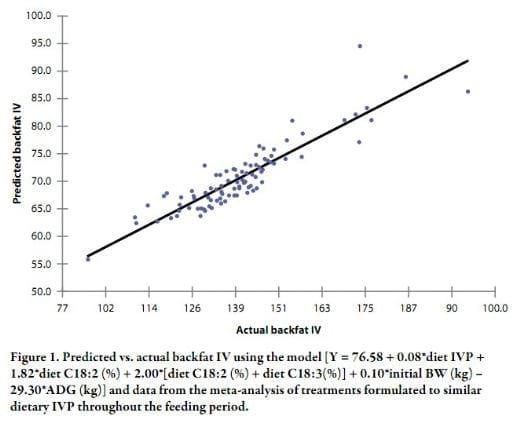
The prediction equation for backfat IV was improved considerably by including multiple variables to characterize the diet, as well as to describe the growth and rate at which it occurred. Using the dietary concentration of C18:2 + C18:3 (Adjusted R 2 = 0.61) and/or backfat depth (Adjusted R 2= 0.64) resulted in improvements over using the diet IVP alone (Adjusted R 2= 0.58). Further improvements were obtained by adding the dietary C18:2 with or without C18:2 + C18:3 concentrations to an equation with the diet IVP, and replacing backfat depth with ADG and initial BW (Adjusted R2 = 0.79). The equation that included the diet IVP, percentage dietary C18:2, percentage total dietary C18:2 + C18:3, initial BW, and ADG resulted in the greatest R 2 (Adjusted R 2=0.80). Figure 1 shows the precision with which this equation was able to predict the IV when compared to actual data.
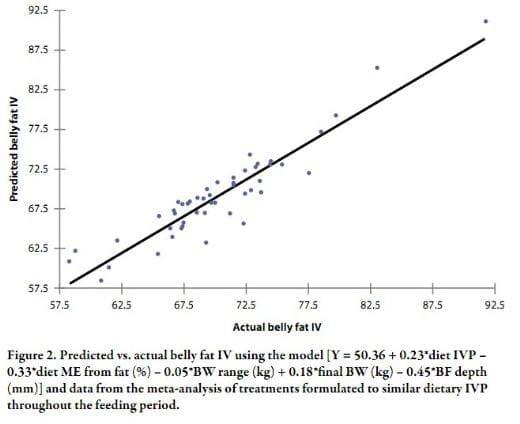
The prediction equation for belly fat IV was improved by including multiple variables to characterize diet and growth. Adding the dietary percentage of ME from fat as an adjustment to the dietary IVP (Adjusted R 2 = 0.80) and/or variables to describe the weight during which the diet was fed and the ending backfat depth resulted in greater precision. The equation that included the diet IVP, percentage of ME from fat, BW range, ending BW, and backfat depth resulted in the greatest R 2 (Adjusted R 2= 0.89,Figure 2).
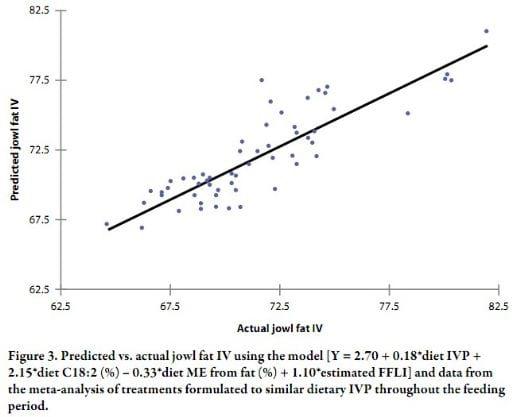
The prediction equation for jowl fat IV was improved by including more than one dietary variable and an estimate of carcass lean. Beginning with the simple equation using dietary IVP (Adjusted R 2 = 0.44), replacing it with the dietary concentration of C18:2 or adding the estimated FFLI (Adjusted R 2 = 0.57) resulted in increased precision. Further precision was obtained by adding back the diet IVP and the percentage of ME from fat, and using either the backfat depth (Adjusted R 2 = 0.71) or estimated FFLI. The equation that included the diet IVP, percentage of C18:2, percentage of ME from fat, and estimated FFLI resulted in the greatest R 2 (Adjusted R2= 0.73, Figure 3).
Meta-analyses of experiments evaluating dietary IVP-reduction strategies
Correlations
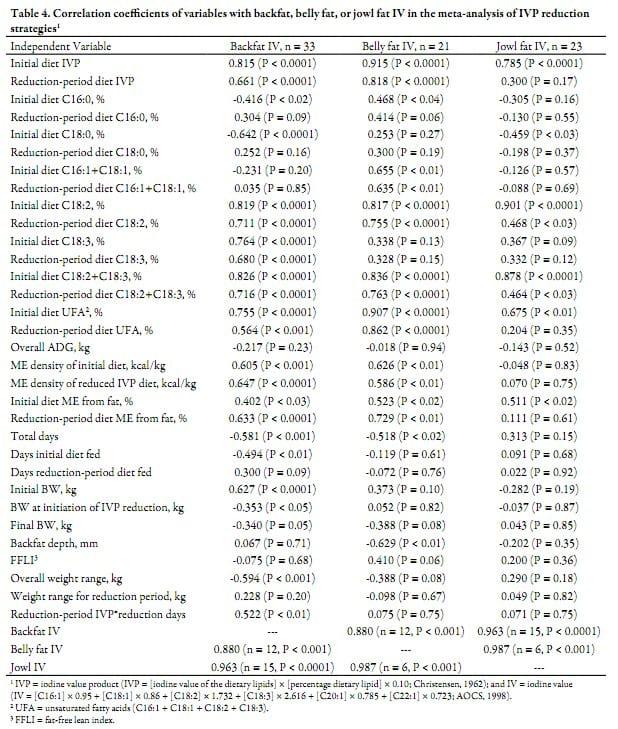
Backfat, belly fat, and jowl fat IV were all highly correlated (r ≥ 0.880; P < 0.001) to each other (Table 4). As in the previous meta-analysis, dietary characteristics had the highest correlations with the carcass backfat, belly fat, and jowl fat IV. Various measures of the fatty acids in the initial dietary treatment had the highest correlations with the backfat IV, primarily the percentage of C18:2 (r = 0.819; P < 0.0001), C18:3 (r = 0.764; P < 0.0001), total C18:2 + C18:3 (r = 0.826; P < 0.0001), total unsaturated fatty acids (r = 0.755; P < 0.0001), and the diet IVP (r = 0.815; P < 0.0001). The same dietary characteristics of the IVP reduction treatment were also correlated (r ≥ 0.564; P < 0.0001) with the backfat IV, as well as the ME density (r ≥ 0.605; P < 0.001) and percentage of ME from fat (r ≥ 0.402; P < 0.03) for both the initial and reductionperiod diets. For belly fat IV, the initial dietary percentage of total C16:1 + C18:1 (r = 0.655; P < 0.01), C18:2 (r = 0.817; P < 0.0001), total C18:2 + C18:3 (r = 0.836; P < 0.0001), total unsaturated fatty acids (r = 0.907; P < 0.0001), and the diet IVP (r = 0.915; P < 0.0001) were all highly correlated. The same dietary characteristics of the IVP-reduction treatment were also correlated (r ≥ 0.635; P < 0.01) with the belly fat IV, as well as the ME density (r ≥ 0.586; P < 0.01) and percentage of ME from fat (r ≥ 0.523; P < 0.02) for both the initial and reduction-period diets. For jowl fat IV, the percentage of C18:2 (r = 0.901; P < 0.0001), total C18:2 + C18:3 (r = 0.878; P < 0.0001), total unsaturated fatty acids (r = 0.675; P < 0.01), and the IVP (r = 0.785; P < 0.0001) of the initial diet had the highest correlations. The dietary percentage of C18:2 and total C18:2 + C18:3 of the IVP-reduction treatment were also correlated (r ≥ 0.464; P < 0.03) with the jowl fat IV, as well as the percentage of ME from fat (r = 0.511; P < 0.02) in the initial diet.
Other variables were found to be correlated with the backfat and belly fat IV. The total length of the feeding period was negatively correlated with the backfat IV (r = -0.581;P < 0.001) and belly fat IV (r = -0.518; P < 0.02), and the number of days the initial diet was fed was negatively correlated with the backfat IV (r = -0.494; P < 0.01). Additionally, the initial BW (r = 0.627; P < 0.0001), overall BW range (r = -0.594; P < 0.001), reduction-period diet IVP × actual reduction-period days (r = 0.522; P < 0.01), BW at the initiation of the reduction period (r = -0.353; P < 0.05), and final BW (r = -0.340; P = 0.05) were correlated with the backfat IV. As in the previous meta-analysis, backfat depth was negatively correlated (r = -0.629; P < 0.01) with the belly fat IV. Jowl IV was not correlated with growth and carcass variables.
Prediction equations
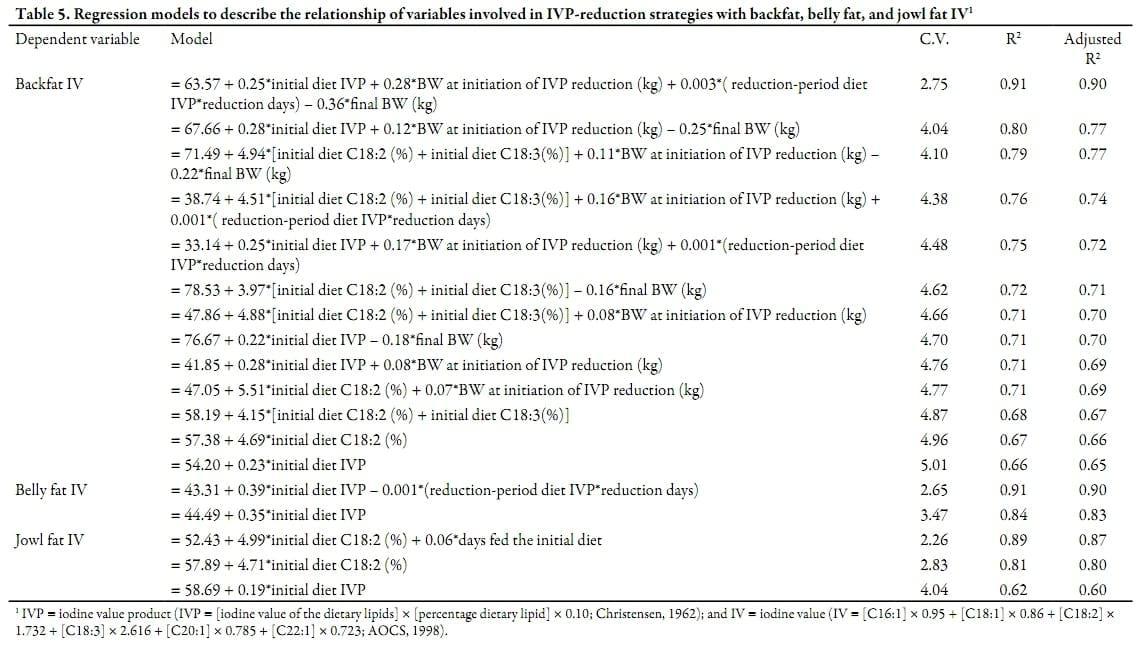
Regression analyses of the dietary characteristics; growth, carcass, and BW data; along with feeding durations resulted in equations to predict backfat, belly fat, and jowl fat IV (Table 5.). Although the meta-analysis of diet IVP-reduction treatments was performed primarily with data not included in the previous meta-analysis, the prediction equations resulting in the greatest precision for determining the backfat, belly fat, and jowl fat IV used the same dietary variables. Similar to the previous meta-analysis, the equations with a single predictor demonstrated the primary influence of dietary unsaturated fatty acids on the IV of pork fat. However, the best single predictors were derived from the unsaturated fatty acid characteristics of the initial diet rather than the final diet.
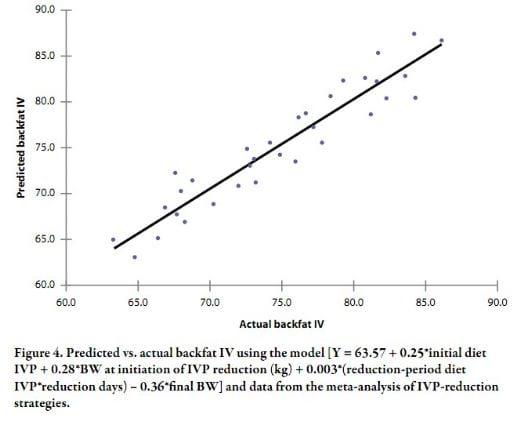
Improved equations for backfat IV were obtained by using either the IVP, concentration of C18:2, or concentration of C18:2 + C18:3 of the initial diet and the BW at the initiation of IVP reduction, reduction-period diet IVP × actual reduction-period days, and/or the final BW rather than the IVP of the initial diet alone. The equation that included the IVP of the initial diet, the BW at the initiation of IVP reduction, the reduction-period diet IVP × actual reduction-period days, and the final BW resulted in the greatest R 2 (Adjusted R2= 0.90). The precision with which this equation was able to predict the IV when compared to the actual data is shown in Figure 4.
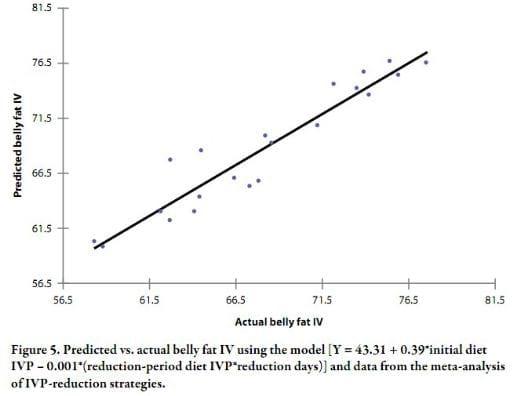
Similar to the previous meta-analysis, the prediction equation for belly fat IV included the IVP of the initial diet. The precision of the equation was improved by including the reduction-period diet IVP × actual reduction-period days (Adjusted R 2 = 0.90, Figure 5).
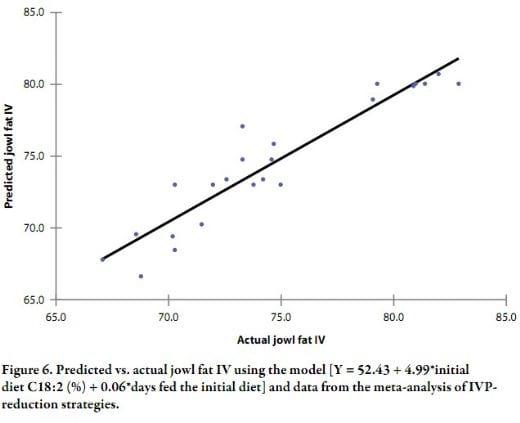
The concentration of C18:2 in the initial diet was an important dietary variable for predicting jowl fat IV. The prediction equation was improved by including the number of days that the initial diet was fed (Adjusted R 2 = 0.87, Figure 6).
Discussion
It is well established that the fatty acid composition of pig adipose tissue can be manipulated by changing the amounts and proportions of fatty acids in the diet (Wood et al., 2003 7). This is also evident in the meta-analyses. The equations with a single predictor, similar to the equation developed by Boyd et al. (1997), demonstrate the primary influence of the dietary unsaturated fatty acid concentration on the IV of pork fat. Madsen et al. (1992 8) reported the positive linear relationship between the dietary and adipose tissue contents of polyunsaturated fatty acids. The diet IVP and fat IV describe the combined characteristics of the mono- and polyunsaturated fatty acid content of a particular fat. Therefore, it is not surprising that the diet IVP is a common predictor of IV across many of the prediction equations in the analyses.
Although the data from Boyd et al. (1997) were included in the meta-analyses for back- fat and belly fat IV, the R2 of the equations using a single measure of the dietary unsaturated fatty acid concentration as a predictor was considerably less than that reported by Madsen et al. (1992) and Boyd et al. (1997). The equation of Madsen et al. (1992) (IV = 47.1 + 0.14 × IVP/day, R2= 0.86) was derived from Danish experiments using individually housed pigs limit-fed a dietary IVP within the range of 37 to 88 (IVP/day of 42 to 190) from 20 kg BW until harvest at 90 kg BW. The equation of Boyd et al. (IV = 52.4 + 0.32 × IVP, R2= 0.99) was derived from a single controlled experiment, with an IVP in the range of 44 to 90 for pigs fed ad libitum from 43 kg BW until harvest at 118 kg BW. In the current meta-analyses, the simple equations for predicting backfat IV using the diet IVP were derived from multiple studies. The equation (backfat IV = 57.89 + 0.18 × IVP, R 2= 0.58) from the meta-analysis of feeding a continuous IVP included data with an initial BW range of 50 to 200 lb, a final BW range of 97 to 300 lb, and a diet IVP range of 5 to 187. The equation (backfat IV = 54.20 + 0.23 × IVP of the initial diet, R 2= 0.66) from the meta-analysis of IVP-reduction strategies included data with an initial BW range of 85 to 140 lb, a final BW range of 227 to 290 lb, and a diet IVP range of 43 to 111. Nguyen et al. (2003 9 ) demonstrated that the variation in the fatty acid composition of pork adipose tissue is increased when data from various experiments are pooled, resulting in weaker correlations than those obtained in an individual experiment. The increased variation results from differences in the conditions across the experiments. In the present analyses, accounting for some of these differences resulted in improved equations for predicting backfat, belly fat, and jowl fat IV.
Other variables are known to influence the amount, composition, and quality of pork fat. Several reviews have been published that describe some of these variables. Wood et al. (2008 10 ) described the relationships of backfat thickness, gender, and the age, BW, or maturity of growing pigs with fat composition. Younger, lighter, and leaner pigs were found to have lower concentrations of C18:0 and C18:1 and greater concentrations of C18:2 in their subcutaneous adipose tissue; and this is also the case when intact males and gilts are compared to castrates. Fat quality defects are more common in pigs from very lean strains that are slaughtered at lower weights and with thinner backfat. The genetic influence on the fatty acid composition of adipose tissue in swine has been previously described (Wood et al., 2003), but the differences observed between genotypes are likely attributable to their differences in leanness and subcutaneous fat depth. Gender differences in fat composition are also a function of the differences in subcutaneous fat depth and leanness, and differences found between intact males and females with the same backfat thickness indicate that the adipose tissue of intact males may be less mature than that of castrates and females. The current analyses support the conclusion that the backfat depth or lean characteristics account for many of the differences observed between genotypes and genders, and that backfat depth is negatively correlated with the IV of carcass fat.
Relatively few experiments have evaluated the effects on carcass fatty acids of reducing the major dietary sources of unsaturated fatty acids for a period before slaughter. Six experiments were used in our meta-analyses of IVP-reduction treatments. Thirty of the 50 observations represented IVP-reduction treatments, or dietary strategies to reduce the effects on fat IV of the initial diet fed. The other 20 observations were the control treatments and were also used in the first meta-analyses of various levels of diet IVP fed throughout the feeding period. Nevertheless, the same characteristics of the initial diet were important for modeling the backfat IV, belly fat IV, and jowl fat IV in both sets of data.
An important finding was that the characteristics of the initial diet were most important for predicting the fat IV of pigs fed IVP-reduction treatments. The activity of lipogenic enzymes involved in the de novo synthesis of adipose tissue is reduced with increasing levels of dietary fatty acids (Allee et al., 1971 11 ). However, data could not be found to describe the changes in activity of these enzymes after a reduction of dietary fatty acids for growing-finishing pigs. In the existing data, although not measured directly, it would appear that the changes in lipogenic enzyme activity are not easily reversed in growing-finishing pigs.
Backfat IV may be the most amenable to change using an IVP-reduction strategy; and this may be accomplished by initiating the strategy at a lighter BW and feeding to a heavier final BW. Jowl fat IV appears to be the most difficult to modify using an IVPreduction strategy, and nutritionists and producers may be limited in their selection of ingredients when IV testing standards are based on a measurement of jowl fat.
The demand for lean pork, coupled with the increased utilization of DDGS as a swine feed ingredient, have stimulated greater interest in understanding the factors that influence pork fat quality. The meta-analyses described here provide for a greater understanding of the factors that are known to influence pork fat quality. Furthermore, the relationships described in the prediction equations obtained should prove to be useful for producing pork with acceptable fat quality.
Notes:
2 Whitney, M. H., G. C. Shurson, L. J. Johnston, D. M. Wulf, and B. C. Shanks. 2006. Growth performance and carcass characteristics of grower-finisher pigs fed high-quality corn distillers dried grain with solubles originating from a modern Midwestern ethanol plant. J. Anim. Sci. 84:3356-3363.
3 Hugo, A., and E. Roodt. 2007. Significance of porcine fat quality in meat technology: a review. Food Rev. Intl. 23:175-198.
4 Boyd, R. D., M. E. Johnston, K. Scheller, A. A. Sosnicki, and E. R. Wilson. 1997. Relationship between dietary fatty acid profile and body fat composition in growing pigs. PIC Technical Memo 153. PIC, Franklin, KY.
5 Benz, J. M. 2008. Influence of dietary ingredients on pork fat quality. Ph.D. dissertation. Kansas State University, Manhattan.
6 NRC. 1998. Nutrient Requirements of Swine. 10th rev. ed. Natl. Acad. Press, Washington D.C.
7 Wood, J. D., R. I. Richardson, G. R. Nute, A. V. Fisher, M. M. Campo, E. Kasapidou, P. R. Sheard, and M. Enser. 2003. Effects of fatty acids on meat quality: a review. Meat Sci. 66:21-32.
8 Madsen, A., K. Jakobsen, and H. P. Mortensen. 1992. Influence of dietary fat on carcass fat quality in pigs. A review. Acta. Agric. Scand. 42:220-225.
9 Nguyen, L. Q., M. C. G. A. Nuijens, H. Everts, N. Salden, and A. C. Beynen. 2003. Mathematical relationships between the intake of n-6 and n-3 polyunsaturated fatty acids and their contents in adipose tissue of growing pigs. Meat Sci. 65:1399-1406.
10 Wood, J. D., M. Enser, A. V. Fisher, G. R. Nute, P. R. Sheard, R. I. Richardson, S. I. Hughes, and F. M. Whittington. 2008. Fat deposition, fatty acid composition and meat quality: A review. Meat Sci. 78:343- 358.
11 Allee, G. L., D. H. Baker, and G. A. Leveille. 1971. Influence of level of dietary fat on adipose tissue lipogenesis and enzymatic activity in the pig. J. Anim. Sci. 33:1248-1254.
Concern about the quality of pork fat has increased in the United States over the last decade, largely because of the increased availability and use of dried distillers grains with solubles (DDGS) in swine diets. The iodine value (IV) of pork fat is commonly used as an indicator of quality. To identify the factors associated with carcass fat IV, meta-analyses were conducted to describe the relevant variables and to develop prediction equations to assist swine nutritionists and producers in producing pork fat with an acceptable IV. Data from 21 experiments were used to develop prediction equations for carcass fat IV of pigs fed a relatively constant dietary iodine value product (IVP) throughout the feeding period, and 6 experiments were used to develop prediction equations for carcass fat IV of pigs fed a dietary IVP-reduction strategy before marketing. Backfat, belly fat, and jowl fat IV were all highly correlated among the experiments that measured the IV of the multiple fat depots (r ≥ 0.880; P < 0.001). As expected, the dietary concentrations of unsaturated (primarily polyunsaturated) fatty acids were the most important in predicting carcass fat IV. However, improved prediction models were achieved by including variables to describe the pigs' initial and final BW, ADG, and carcass leanness. Increased ADG, final BW, BW range over course of the diet, and backfat depth resulted in reduced backfat IV (P < 0.02). Belly fat IV was also reduced with increasing final BW, BW range over course of the diet, and backfat depth (P < 0.03). A reduced jowl fat IV was associated with an increase in backfat depth and a lower fat-free lean index (FFLI, P < 0.02). Data analyzed to develop equations for predicting carcass fat IV using a dietary IVP-reduction strategy indicated that the concentrations of dietary polyunsaturated fatty acids in the initial diet were the most important. The concentrations of dietary polyunsaturated fatty acids in the reducedIVP diet fed before marketing were also important in predicting the IV of carcass fat. However, the IV of backfat was the most amenable to change using an IVP-reduction strategy. Feeding the pigs for a longer period and to a heavier final BW resulted in a reduced backfat IV (P ≤ 0.05). These results indicate that, although primarily determined by dietary factors, an understanding of the other variables that influence the IV of pork fat is necessary to reduce the likelihood of concerns with pork fat quality.
Key words: fat quality, fatty acids, iodine value, prediction equation
Introduction
Attention to the quality of pork fat has increased in the United States over the last decade, largely because of greater availability and use of dried distillers grains with solubles (DDGS) in swine diets. Feeding 10 to 30% or more DDGS may not affect carcass lean characteristics, but results in an increase in unsaturated carcass fat and the likelihood of soft bellies (Whitney et al., 2006 2 ). Recent economic circumstances have encouraged pork producers to feed greater concentrations of DDGS, despite anticipated reductions in growth performance. As a result, some processors have become increasingly involved in the feeding practices employed by pork producers. Iodine value (IV) is currently utilized as a standard indicator of carcass-fat quality in the United States. It provides an overall estimate of the unsaturated fatty acid content (greater IV = greater unsaturated fatty acid concentration), and it serves as an indicator of the fat firmness (greater IV = softer fat) and risk for rancidity (greater IV = increased risk of rancidity). However, carcass-fat quality standards can vary considerably. Various thresholds for backfat IV have ranged from 60 (Hugo & Roodt, 2007 3 ) to 74 (Boyd et al., 1997 4). Currently, one U.S. processor (Triumph Foods, St. Joseph, MO) routinely samples carcass jowl fat for IV and has established a threshold of 73. However, the IV of pork fat differs according to anatomical location, with the IV of jowl fat generally being greater than that of backfat (Benz et al., 2008 5).
Therefore, meta-analyses were conducted to determine (1) the effects of dietary fatty acids (or dietary IVP) and variables associated with growth and carcass characteristics on the backfat, belly fat, and jowl fat fatty acids (or IV) and (2) the effects of dietary fatty acid (or IVP)- reduction strategies on the backfat, belly fat, and jowl fat fatty acids (or IV). The data for the first objective were utilized to develop equations to improve our ability to predict backfat, belly fat, and jowl fat IV. Data for the second objective were used to develop equations to improve our ability to use IVP-reduction strategies to meet acceptable fat-quality standards.
Procedures
Data Selection
The data used for the meta-analyses were obtained from numerous sources. A comprehensive search for published data was conducted via the Kansas State University (K-State) Libraries, using the Internet and the ISI Web of Knowledge/CABI search engine. Additional data were obtained through communication with authors affiliated with their studies. Data from both refereed and non-refereed publications, such as theses, technical memos, and university publications, were included.
Data interpretation
The IVP of every treatment diet was calculated as [IV of the dietary lipids] × [percentage dietary lipid] × 0.10, even when already reported, to ensure a uniform interpretation of dietary IVP across experiments. The IV of the lipid fraction of the dietary ingredients was calculated with the American Oil Chemists' Society (AOCS 1998) equation (IV = [C16:1] × 0.95 + [C18:1] × 0.86 + [C18:2] × 1.732 + [C18:3] × 2.616 +[C20:1] × 0.785 + [C22:1] × 0.723), using either the published fatty acid values for added fat sources (NRC, 1998 6) or the analyzed profiles of the diet or diet components when reported. When analyzed values for the fat or fatty acid content were not provided for corn and soybean-based ingredients, the fatty acid profiles were calculated by using the NRC (1986) values for their fat content and the fatty acid profiles from corn oil and soybean oil (Table 1).
For treatments applied over more than one dietary phase to achieve a desired IVP or dietary fatty acid treatment, the mean IVP, mean content of fatty acids, mean ME density, and the mean percentage of dietary ME from fat of the diets were used to describe the treatment applied.
The analyzed fatty acid composition of backfat, belly fat, and jowl fat were used to calculate their IV with the AOCS (1998) equation (IV = [C16:1] × 0.95 + [C18:1] × 0.86 + [C18:2] × 1.732 + [C18:3] × 2.616 + [C20:1] × 0.785 + [C22:1] × 0.723) when the IV was not already reported using this equation.
Overall, 21 experiments were used to develop models for predicting the backfat, belly fat, or jowl fat IV of pigs fed a relatively constant IVP throughout the feeding period. For the analysis of IVP-reduction strategies, 6 experiments were used for modeling the backfat, belly fat, or jowl fat IV.
Statistical analyses
Each dietary IVP-treatment strategy applied within each study was considered the experimental unit (or observation) for modeling the effects of diet, duration, growth, and carcass fat/lean characteristics on backfat, belly fat, and jowl fat IV. The specific variables of interest included in the data were the experiment, genetic line, gender, dietary treatment IVP, grain source(s), protein source(s), added fat source(s), average caloric density (ME, kcal/kg), average C16:0 (%), average C18:0 (%), average C16:1+C18:1 (%), average C18:2 (%), average C18:3 (%), diet ME from fat (%), initial BW (kg), total duration (d), ADG (kg), ending BW (kg), BW range (ending BW - initial BW, kg), HCW (kg), backfat depth (mm), FFLI, and backfat IV, belly fat IV, and/or jowl fat IV.
For the meta-analysis of IVP-reduction strategies, the same dietary variables of interest were used for the diet fed during the period of reduced IVP. The total duration of the feeding period was also divided into the number of pre-reduction and actual reduction days. Interim BW was also included for the reduction analysis, and the BW range during the pre-reduction and actual reduction periods were included. An additional variable was created for the IVP-reduction analyses by multiplying the dietary IVP fed during the reduction period by the number of days in the period. This was necessary to describe the combined effect of the reduced IVP and duration that it was fed. All other variables remained the same as the previous meta-analysis of pigs fed a constant IVP.
The data for both meta-analyses were analyzed using the correlation, general linear models, and regression procedures of the SAS (SAS Institute, Inc., Cary, NC). The correlation procedure was used to indicate the significance of the relationship of each independent variable to the backfat IV, belly fat IV, and jowl fat IV, and to identify the significance of the relationship of IV among the 3 fat depots. The general linear models procedure was used to test the variables for significant interactions, and the regression procedure was used to develop prediction equations for backfat, belly fat, and jowl fat IV using a stepwise approach. The models were first developed without using the dummy variables for gender. Intercept-adjusted collinearity diagnostics (using the SAS syntax = COLLINOINT) and variance inflation factor (SAS syntax = VIF) were used to assist with the identification of variables with collinearity. Pairwise collinearity of variables was indicated by a condition index of ≥ 30 or a variance inflation of ≥ 10. When 2 variables were found to be collinear, the variable that provided the greatest R2 was kept in the model, and the other variable was excluded. Additionally, plots of the residuals were examined to identify influential observations, but no observations were identified and removed for introducing bias into the models. Lastly, the dummy variables were tested with the final models to evaluate the influence of gender on backfat IV, belly fat IV, and jowl fat IV. Overall, correlations, interactions, variables, and models were considered significant at P < 0.05.
Results
Meta-analyses of experiments with treatments consisting of a continuous IVP throughout the feeding period
Correlations
Backfat, belly fat, and jowl fat IV were all highly correlated (r ≥ 0.887; P < 0.0001) to each other (Table 2). Dietary characteristics had the highest correlations with the carcass backfat, belly fat, and jowl fat IV. For backfat IV, the total dietary concentration of C18:2 and C18:3 had the highest correlation (r = 0.782; P < 0.0001); followed by the diet IVP (r =0.765; P < 0.0001), dietary concentration of C18:2 (r = 0.689; P < 0.0001), total dietary concentration of the unsaturated fatty acids C16:1, C18:1, C18:2, and C18:3 (r = 0.618; P < 0.0001), percentage of the diet ME from fat (r = 0.506; P < 0.0001), and dietary concentration of C18:3 (r = 0.418; P < 0.0001). For belly fat IV, the diet IVP had the highest correlation (r = 0.882; P < 0.0001); followed by the total dietary concentration of C18:2 and C18:3 (r = 0.881; P < 0.0001), total dietary concentration of the unsaturated fatty acids C16:1, C18:1, C18:2, and C18:3 (r = 0.776; P < 0.0001), dietary concentration of C18:3 (r = 0.635; P < 0.0001), percentage of the diet ME from fat (r = 0.629; P < 0.0001), dietary concentration of C18:2 (r = 0.608; P < 0.0001), total dietary concentration of C16:1 and C18:1 (r = 0.335; P < 0.02), and the ME density of the diet (r = 0.324; P < 0.03). For jowl fat IV, the dietary concentration of C18:2 had the highest correlation (r = 0.759; P < 0.0001), followed by the total dietary concentration of C18:2 and C18:3 (r = 0.754; P < 0.0001), diet IVP (r = 0.671; P < 0.0001), total dietary concentration of the unsaturated fatty acids C16:1, C18:1, C18:2, and C18:3 (r = 0.536; P < 0.0001), percentage of the diet ME from fat (r = 0.346; P < 0.01), dietary concentration of C18:3 (r = 0.298; P < 0.03), and total dietary concentration of C16:1 and C18:1 (r = 0.256; P = 0.05).
As expected, growth and/or carcass variables were also found to be significantly correlated with backfat, belly fat, and jowl fat IV. For backfat IV, the ending BW had the highest negative correlation (r = -0.318; P < 0.01), followed by the weight range fed (r = -0.257; P < 0.02), backfat depth (r = -0.245; P < 0.02), and ADG (r = -0.242; P < 0.02). For belly fat IV, the ending BW and backfat depth had the highest negative correlation (r = -0.395; P < 0.01), followed by the weight range fed (r = -0.317; P < 0.03), with trends (P ≤ 0.06) for a negative correlation for days fed (r = -0.271) and a
positive correlation for FFLI (r = 0.272). Jowl IV was negatively correlated with backfat depth (r = -0.365; P < 0.01) and positively correlated with FFLI (r = 0.315; P < 0.02).
Prediction equations
The regression analyses of dietary and growth characteristics resulted in equations to predict backfat, belly fat, and jowl fat IV (Table 3). Equations using a single predictor demonstrated the primary influence of dietary unsaturated fatty acids on the IV of pork fat. However, improved equations were obtained by including multiple variables to describe the diet, animals, and growth.
The prediction equation for backfat IV was improved considerably by including multiple variables to characterize the diet, as well as to describe the growth and rate at which it occurred. Using the dietary concentration of C18:2 + C18:3 (Adjusted R 2 = 0.61) and/or backfat depth (Adjusted R 2= 0.64) resulted in improvements over using the diet IVP alone (Adjusted R 2= 0.58). Further improvements were obtained by adding the dietary C18:2 with or without C18:2 + C18:3 concentrations to an equation with the diet IVP, and replacing backfat depth with ADG and initial BW (Adjusted R2 = 0.79). The equation that included the diet IVP, percentage dietary C18:2, percentage total dietary C18:2 + C18:3, initial BW, and ADG resulted in the greatest R 2 (Adjusted R 2=0.80). Figure 1 shows the precision with which this equation was able to predict the IV when compared to actual data.
The prediction equation for belly fat IV was improved by including multiple variables to characterize diet and growth. Adding the dietary percentage of ME from fat as an adjustment to the dietary IVP (Adjusted R 2 = 0.80) and/or variables to describe the weight during which the diet was fed and the ending backfat depth resulted in greater precision. The equation that included the diet IVP, percentage of ME from fat, BW range, ending BW, and backfat depth resulted in the greatest R 2 (Adjusted R 2= 0.89,Figure 2).
The prediction equation for jowl fat IV was improved by including more than one dietary variable and an estimate of carcass lean. Beginning with the simple equation using dietary IVP (Adjusted R 2 = 0.44), replacing it with the dietary concentration of C18:2 or adding the estimated FFLI (Adjusted R 2 = 0.57) resulted in increased precision. Further precision was obtained by adding back the diet IVP and the percentage of ME from fat, and using either the backfat depth (Adjusted R 2 = 0.71) or estimated FFLI. The equation that included the diet IVP, percentage of C18:2, percentage of ME from fat, and estimated FFLI resulted in the greatest R 2 (Adjusted R2= 0.73, Figure 3).
Meta-analyses of experiments evaluating dietary IVP-reduction strategies
Correlations
Backfat, belly fat, and jowl fat IV were all highly correlated (r ≥ 0.880; P < 0.001) to each other (Table 4). As in the previous meta-analysis, dietary characteristics had the highest correlations with the carcass backfat, belly fat, and jowl fat IV. Various measures of the fatty acids in the initial dietary treatment had the highest correlations with the backfat IV, primarily the percentage of C18:2 (r = 0.819; P < 0.0001), C18:3 (r = 0.764; P < 0.0001), total C18:2 + C18:3 (r = 0.826; P < 0.0001), total unsaturated fatty acids (r = 0.755; P < 0.0001), and the diet IVP (r = 0.815; P < 0.0001). The same dietary characteristics of the IVP reduction treatment were also correlated (r ≥ 0.564; P < 0.0001) with the backfat IV, as well as the ME density (r ≥ 0.605; P < 0.001) and percentage of ME from fat (r ≥ 0.402; P < 0.03) for both the initial and reductionperiod diets. For belly fat IV, the initial dietary percentage of total C16:1 + C18:1 (r = 0.655; P < 0.01), C18:2 (r = 0.817; P < 0.0001), total C18:2 + C18:3 (r = 0.836; P < 0.0001), total unsaturated fatty acids (r = 0.907; P < 0.0001), and the diet IVP (r = 0.915; P < 0.0001) were all highly correlated. The same dietary characteristics of the IVP-reduction treatment were also correlated (r ≥ 0.635; P < 0.01) with the belly fat IV, as well as the ME density (r ≥ 0.586; P < 0.01) and percentage of ME from fat (r ≥ 0.523; P < 0.02) for both the initial and reduction-period diets. For jowl fat IV, the percentage of C18:2 (r = 0.901; P < 0.0001), total C18:2 + C18:3 (r = 0.878; P < 0.0001), total unsaturated fatty acids (r = 0.675; P < 0.01), and the IVP (r = 0.785; P < 0.0001) of the initial diet had the highest correlations. The dietary percentage of C18:2 and total C18:2 + C18:3 of the IVP-reduction treatment were also correlated (r ≥ 0.464; P < 0.03) with the jowl fat IV, as well as the percentage of ME from fat (r = 0.511; P < 0.02) in the initial diet.
Other variables were found to be correlated with the backfat and belly fat IV. The total length of the feeding period was negatively correlated with the backfat IV (r = -0.581;P < 0.001) and belly fat IV (r = -0.518; P < 0.02), and the number of days the initial diet was fed was negatively correlated with the backfat IV (r = -0.494; P < 0.01). Additionally, the initial BW (r = 0.627; P < 0.0001), overall BW range (r = -0.594; P < 0.001), reduction-period diet IVP × actual reduction-period days (r = 0.522; P < 0.01), BW at the initiation of the reduction period (r = -0.353; P < 0.05), and final BW (r = -0.340; P = 0.05) were correlated with the backfat IV. As in the previous meta-analysis, backfat depth was negatively correlated (r = -0.629; P < 0.01) with the belly fat IV. Jowl IV was not correlated with growth and carcass variables.
Prediction equations
Regression analyses of the dietary characteristics; growth, carcass, and BW data; along with feeding durations resulted in equations to predict backfat, belly fat, and jowl fat IV (Table 5.). Although the meta-analysis of diet IVP-reduction treatments was performed primarily with data not included in the previous meta-analysis, the prediction equations resulting in the greatest precision for determining the backfat, belly fat, and jowl fat IV used the same dietary variables. Similar to the previous meta-analysis, the equations with a single predictor demonstrated the primary influence of dietary unsaturated fatty acids on the IV of pork fat. However, the best single predictors were derived from the unsaturated fatty acid characteristics of the initial diet rather than the final diet.
Improved equations for backfat IV were obtained by using either the IVP, concentration of C18:2, or concentration of C18:2 + C18:3 of the initial diet and the BW at the initiation of IVP reduction, reduction-period diet IVP × actual reduction-period days, and/or the final BW rather than the IVP of the initial diet alone. The equation that included the IVP of the initial diet, the BW at the initiation of IVP reduction, the reduction-period diet IVP × actual reduction-period days, and the final BW resulted in the greatest R 2 (Adjusted R2= 0.90). The precision with which this equation was able to predict the IV when compared to the actual data is shown in Figure 4.
Similar to the previous meta-analysis, the prediction equation for belly fat IV included the IVP of the initial diet. The precision of the equation was improved by including the reduction-period diet IVP × actual reduction-period days (Adjusted R 2 = 0.90, Figure 5).
The concentration of C18:2 in the initial diet was an important dietary variable for predicting jowl fat IV. The prediction equation was improved by including the number of days that the initial diet was fed (Adjusted R 2 = 0.87, Figure 6).
Discussion
It is well established that the fatty acid composition of pig adipose tissue can be manipulated by changing the amounts and proportions of fatty acids in the diet (Wood et al., 2003 7). This is also evident in the meta-analyses. The equations with a single predictor, similar to the equation developed by Boyd et al. (1997), demonstrate the primary influence of the dietary unsaturated fatty acid concentration on the IV of pork fat. Madsen et al. (1992 8) reported the positive linear relationship between the dietary and adipose tissue contents of polyunsaturated fatty acids. The diet IVP and fat IV describe the combined characteristics of the mono- and polyunsaturated fatty acid content of a particular fat. Therefore, it is not surprising that the diet IVP is a common predictor of IV across many of the prediction equations in the analyses.
Although the data from Boyd et al. (1997) were included in the meta-analyses for back- fat and belly fat IV, the R2 of the equations using a single measure of the dietary unsaturated fatty acid concentration as a predictor was considerably less than that reported by Madsen et al. (1992) and Boyd et al. (1997). The equation of Madsen et al. (1992) (IV = 47.1 + 0.14 × IVP/day, R2= 0.86) was derived from Danish experiments using individually housed pigs limit-fed a dietary IVP within the range of 37 to 88 (IVP/day of 42 to 190) from 20 kg BW until harvest at 90 kg BW. The equation of Boyd et al. (IV = 52.4 + 0.32 × IVP, R2= 0.99) was derived from a single controlled experiment, with an IVP in the range of 44 to 90 for pigs fed ad libitum from 43 kg BW until harvest at 118 kg BW. In the current meta-analyses, the simple equations for predicting backfat IV using the diet IVP were derived from multiple studies. The equation (backfat IV = 57.89 + 0.18 × IVP, R 2= 0.58) from the meta-analysis of feeding a continuous IVP included data with an initial BW range of 50 to 200 lb, a final BW range of 97 to 300 lb, and a diet IVP range of 5 to 187. The equation (backfat IV = 54.20 + 0.23 × IVP of the initial diet, R 2= 0.66) from the meta-analysis of IVP-reduction strategies included data with an initial BW range of 85 to 140 lb, a final BW range of 227 to 290 lb, and a diet IVP range of 43 to 111. Nguyen et al. (2003 9 ) demonstrated that the variation in the fatty acid composition of pork adipose tissue is increased when data from various experiments are pooled, resulting in weaker correlations than those obtained in an individual experiment. The increased variation results from differences in the conditions across the experiments. In the present analyses, accounting for some of these differences resulted in improved equations for predicting backfat, belly fat, and jowl fat IV.
Other variables are known to influence the amount, composition, and quality of pork fat. Several reviews have been published that describe some of these variables. Wood et al. (2008 10 ) described the relationships of backfat thickness, gender, and the age, BW, or maturity of growing pigs with fat composition. Younger, lighter, and leaner pigs were found to have lower concentrations of C18:0 and C18:1 and greater concentrations of C18:2 in their subcutaneous adipose tissue; and this is also the case when intact males and gilts are compared to castrates. Fat quality defects are more common in pigs from very lean strains that are slaughtered at lower weights and with thinner backfat. The genetic influence on the fatty acid composition of adipose tissue in swine has been previously described (Wood et al., 2003), but the differences observed between genotypes are likely attributable to their differences in leanness and subcutaneous fat depth. Gender differences in fat composition are also a function of the differences in subcutaneous fat depth and leanness, and differences found between intact males and females with the same backfat thickness indicate that the adipose tissue of intact males may be less mature than that of castrates and females. The current analyses support the conclusion that the backfat depth or lean characteristics account for many of the differences observed between genotypes and genders, and that backfat depth is negatively correlated with the IV of carcass fat.
Relatively few experiments have evaluated the effects on carcass fatty acids of reducing the major dietary sources of unsaturated fatty acids for a period before slaughter. Six experiments were used in our meta-analyses of IVP-reduction treatments. Thirty of the 50 observations represented IVP-reduction treatments, or dietary strategies to reduce the effects on fat IV of the initial diet fed. The other 20 observations were the control treatments and were also used in the first meta-analyses of various levels of diet IVP fed throughout the feeding period. Nevertheless, the same characteristics of the initial diet were important for modeling the backfat IV, belly fat IV, and jowl fat IV in both sets of data.
An important finding was that the characteristics of the initial diet were most important for predicting the fat IV of pigs fed IVP-reduction treatments. The activity of lipogenic enzymes involved in the de novo synthesis of adipose tissue is reduced with increasing levels of dietary fatty acids (Allee et al., 1971 11 ). However, data could not be found to describe the changes in activity of these enzymes after a reduction of dietary fatty acids for growing-finishing pigs. In the existing data, although not measured directly, it would appear that the changes in lipogenic enzyme activity are not easily reversed in growing-finishing pigs.
Backfat IV may be the most amenable to change using an IVP-reduction strategy; and this may be accomplished by initiating the strategy at a lighter BW and feeding to a heavier final BW. Jowl fat IV appears to be the most difficult to modify using an IVPreduction strategy, and nutritionists and producers may be limited in their selection of ingredients when IV testing standards are based on a measurement of jowl fat.
The demand for lean pork, coupled with the increased utilization of DDGS as a swine feed ingredient, have stimulated greater interest in understanding the factors that influence pork fat quality. The meta-analyses described here provide for a greater understanding of the factors that are known to influence pork fat quality. Furthermore, the relationships described in the prediction equations obtained should prove to be useful for producing pork with acceptable fat quality.
Notes:
2 Whitney, M. H., G. C. Shurson, L. J. Johnston, D. M. Wulf, and B. C. Shanks. 2006. Growth performance and carcass characteristics of grower-finisher pigs fed high-quality corn distillers dried grain with solubles originating from a modern Midwestern ethanol plant. J. Anim. Sci. 84:3356-3363.
3 Hugo, A., and E. Roodt. 2007. Significance of porcine fat quality in meat technology: a review. Food Rev. Intl. 23:175-198.
4 Boyd, R. D., M. E. Johnston, K. Scheller, A. A. Sosnicki, and E. R. Wilson. 1997. Relationship between dietary fatty acid profile and body fat composition in growing pigs. PIC Technical Memo 153. PIC, Franklin, KY.
5 Benz, J. M. 2008. Influence of dietary ingredients on pork fat quality. Ph.D. dissertation. Kansas State University, Manhattan.
6 NRC. 1998. Nutrient Requirements of Swine. 10th rev. ed. Natl. Acad. Press, Washington D.C.
7 Wood, J. D., R. I. Richardson, G. R. Nute, A. V. Fisher, M. M. Campo, E. Kasapidou, P. R. Sheard, and M. Enser. 2003. Effects of fatty acids on meat quality: a review. Meat Sci. 66:21-32.
8 Madsen, A., K. Jakobsen, and H. P. Mortensen. 1992. Influence of dietary fat on carcass fat quality in pigs. A review. Acta. Agric. Scand. 42:220-225.
9 Nguyen, L. Q., M. C. G. A. Nuijens, H. Everts, N. Salden, and A. C. Beynen. 2003. Mathematical relationships between the intake of n-6 and n-3 polyunsaturated fatty acids and their contents in adipose tissue of growing pigs. Meat Sci. 65:1399-1406.
10 Wood, J. D., M. Enser, A. V. Fisher, G. R. Nute, P. R. Sheard, R. I. Richardson, S. I. Hughes, and F. M. Whittington. 2008. Fat deposition, fatty acid composition and meat quality: A review. Meat Sci. 78:343- 358.
11 Allee, G. L., D. H. Baker, and G. A. Leveille. 1971. Influence of level of dietary fat on adipose tissue lipogenesis and enzymatic activity in the pig. J. Anim. Sci. 33:1248-1254.
Related topics
Authors:

Join to be able to comment.
Once you join Engormix, you will be able to participate in all content and forums.
* Required information
Would you like to discuss another topic? Create a new post to engage with experts in the community.
Create a post


You may be interested in
.jpg&w=3840&q=75)