Introduction
The use of standardized ileal digestible (SID) AA has become a standard approach in diet formulation as it helps to accurately meet a pig’s requirement, and enhance the ingredient utilization. Lysine is the first limiting AA in corn and soybean meal diets for swine. In addition, Lys is used to estimate the requirement of other essential AA; which are expressed as a ratio relative to Lys. Thus, providing the appropriate level of Lys is critical to optimize nursery growth performance. Based on the NRC (1998)2, the SID Lys requirement for nursery pigs from 11 to 44 lb ranges from 1.01% to 1.19%. The NRC (2012)3 updated the recommendation for pigs from 15 to 24 lb to 1.35%, and for pigs from 24 to 55 lb to 1.23% SID Lys. However, recent literature suggests that pigs weighing between 15 to 35 lb have a requirement ranging from 1.30 to 1.50% SID Lys (Nemecheck et al., 2012; Jones et al., 2014)4,5. The objective of this study was to determine the SID Lys requirement of nursery pigs (maternal line barrows) from 15 to 35 lb.
Procedures
The Kansas State University Institutional Animal Care and Use Committee approved the protocol used in this experiment. The study was conducted at the K-State Segregated Early Weaning Facility in Manhattan, KS.
A total of 300 maternal line barrows (Line 200 × 400; DNA, Columbus, NE; initially 14.9 ± 0.5 lb BW) were used in a 21-d growth trial. Pigs were weaned at 21 d of age, balanced by initial BW, and randomly allotted to pens of five pigs upon entry in the nursery. At weaning, pigs were fed a common pelleted diet for 9 d. At d 9 after weaning, considered d 0 in the trial, the pens of pigs were randomly assigned to six different dietary treatments with 10 replications per treatment. The experimental diets consisted of different SID Lys levels (1.05, 1.15, 1.25, 1.35, 1.45, and 1.55%). Each pen was equipped with a 4-hole, dry self-feeder and a nipple waterer to provide ad libitum access to feed and water. Pens of pigs were weighed and feed disappearance was recorded on d 0, 7, 14, and 21 to determine ADG, ADFI, and F/G.
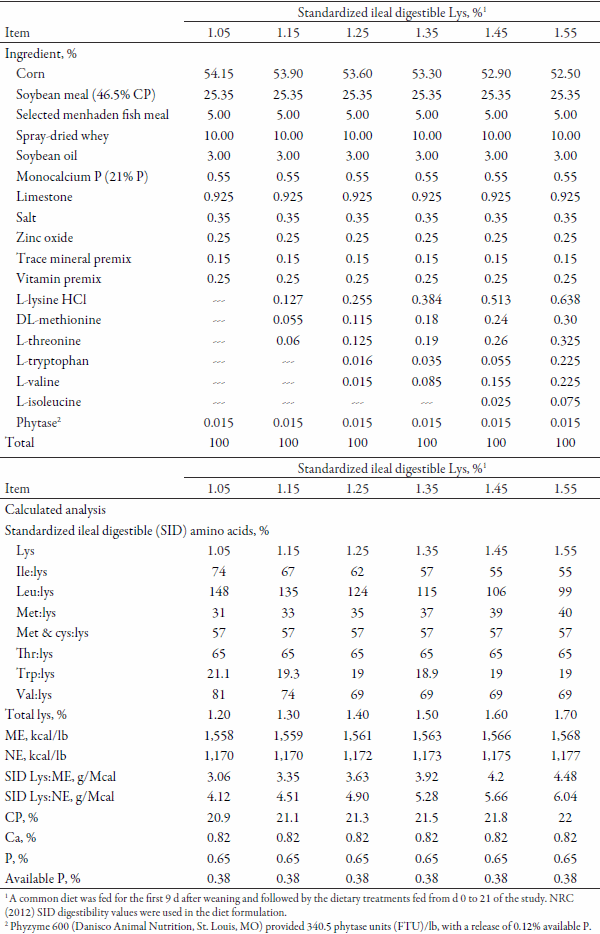
The SID Lys levels of the experimental diets were achieved by increasing the inclusion of crystalline AA, which allowed the amount of soybean meal to stay constant across dietary treatments. Treatment diets were corn and soybean meal based, and contained 5% fish meal, 10% dried whey, and 1.562 Mcal of ME/lb (Table 1). All experimental diets were fed in meal form and were manufactured at the K-State O.H. Kruse Feed Technology Innovation Center.
Table 1. Diet composition (as-fed basis)
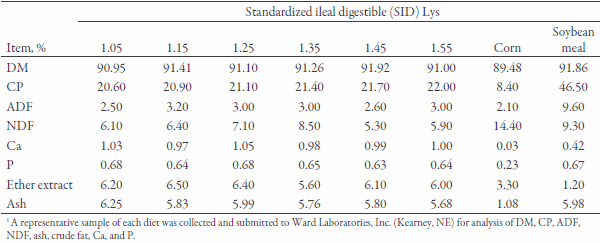
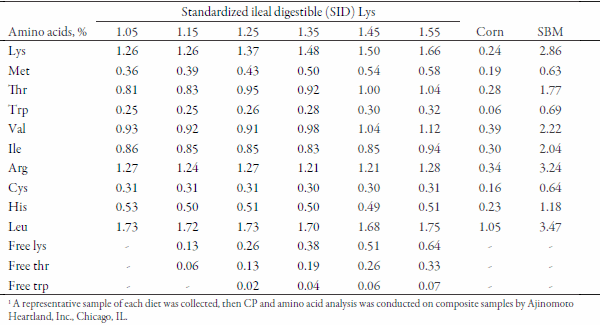
Representative samples of corn and soybean meal used in the diets were collected, and diet samples were taken from six feeders per dietary treatment every wk. After blending, subsamples were analyzed for DM, CP, ADF, NDF, ash, ether extract, Ca, P, Cl, salt, and starch (Ward Laboratories, Inc., Kearney, NE, Table 2). The subsamples were also sent to Ajinomoto Heartland, Inc. (Chicago, IL) for AA analysis (Table 3).
Table 2. Chemical analysis of ingredients and experimental diets (as-fed-basis)1
Table 3. Amino acid composition of ingredients and experimental diets (as-fed-basis)1
For the economic analysis, total feed cost per pig, cost per lb of gain, revenue, and income over feed cost (IOFC) were calculated. The total feed cost per pig was calculated by multiplying the ADFI by diet cost and the number of days it was fed. Cost per lb of gain was calculated by dividing the total feed cost per pig by the total lb gained overall. Revenue per pig was calculated by multiplying the ADG by the total days in the trial times the assumed live price of $75.00 per cwt. To calculate IOFC, total feed cost was subtracted from pig revenue. For all economic evaluations, price of ingredients during summer of 2015 were used; therefore, corn was valued at $4.27/bu ($152.50/ton), soybean meal at $366/ton, L-lysine HCL at $0.72/lb, DL-methionine at $2.70/lb, L-threonine at $1.25/lb, L-tryptophan at $12.00/lb, L-valine at $7.00/lb, and L-isoleucine at $7.00/lb.
The study consisted of a completely randomized design, with pen as the experimental unit. The response variables were analyzed using general linear and non-linear models. Models were expanded to account for heterogeneous residual variances. Polynomial contrasts were implemented in order to evaluate the linear and quadratic effects of the dose response to increasing dietary SID Lys on ADG, ADFI, BW, F/G, feed cost/pig, feed cost/lb of gain, total revenue/pig, and IOFC. Statistical models were fitted using GLIMMIX procedure of SAS (Version 9.3, SAS Institute Inc., Cary, NC). Results were considered significant at P ≤ 0.05 and marginally significant at 0.05 ≤ P ≤ 0.10.
In addition, competing statistical models, including a linear (LM), quadratic polynomial (QP), broken-line linear (BLL), and broken-line quadratic (BLQ), were built using NLMIXED procedure of SAS. Competing dose response models were compared based on the Bayesian information criterion (BIC), where the smaller the value, the better (Milliken et al., 2009)6. The 95% confidence interval of the estimated requirement to reach maximum performance or to reach plateau performance was computed. Results reported correspond to inferences yielded by the best fitting models.
Results and Discussion
Analysis of total AA, free Lys, DM, CP, ADF, NDF, Ca, P, fat, and ash contents of experimental diets (Table 2 and Table 3) showed that all the values were reasonably consistent with formulated levels.
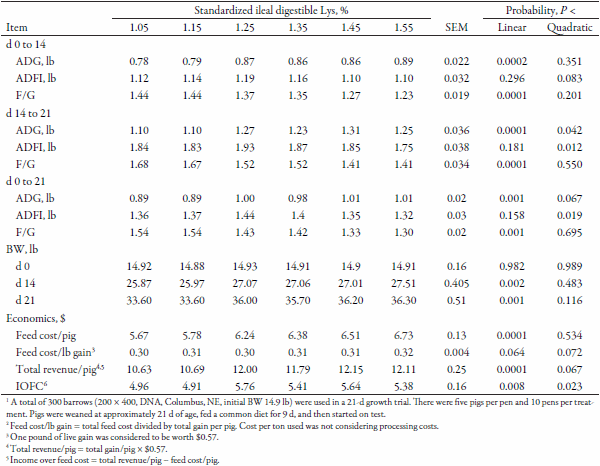
From d 0 to 14, ADG and BW increased (Table 4; linear, P < 0.0002 and P < 0.002, respectively) up to 1.55% SID Lys. In a similar fashion, F/G improved (linear, P < 0.0001) with increasing SID Lys. Contrarily, ADFI tended to increase (quadratic, P < 0.083) from 1.05 to 1.25% SID Lys, with no further increase at highest dietary Lys levels.
Table 4. Least square mean estimates (± SEM) for growth performance of 15 to 35-lb maternal line barrows1
From d 14 to 21, ADG and ADFI increased (quadratic, P < 0.042 and P < 0.012, respectively) from 1.05 to 1.25% SID Lys. There was no further improvement in growth rate at highest levels of Lys. On the contrary, F/G improved (linear, P < 0.0001) up to at least 1.55% SID Lys.
Overall, increasing SID Lys increased ADG and final BW (linear, P < 0.001). There also was a marginal quadratic response for ADG (P < 0.067) driven by the quadratic response in the last wk of the trial, with the greatest increase in ADG as SID Lys increased from 1.05 to 1.25%. Similarly, ADFI increased (quadratic, P < 0.019) from 1.05 to 1.25% SID Lys, with no further increase at greater Lys levels. In contrast, SID Lys seemed to have a greater impact on feed efficiency, which improved (linear, P < 0.001) up to 1.55% SID Lys.
Feed cost per pig increased (linear, P < 0.0001) as SID Lys increased up to the 1.55%. Feed cost per lb of gain did not differ statistically among the dietary treatments. Total revenue per pig increased through the 1.55% SID Lys (linear, P < 0.0001), which is a result of the linear improvement in ADG and final BW. On the contrary, IOFC improved (quadratic, P < 0.023) from 1.05 to 1.25% SID Lys, with no further improvement thereafter.
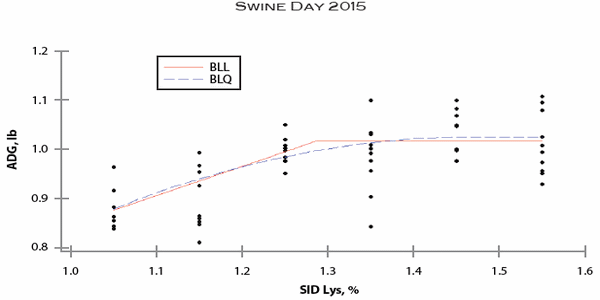
For ADG, the BLL and BLQ models had comparable fit (BIC: 636.7 and 637.7, respectively), while the LM and QP had less adequate fit (BIC: 641.7 and 641.9, respectively). The maximum mean ADG was estimated at 1.29% (95% CI: 1.23, 1.35%) and 1.47% (95% CI: 1.31, 1.64%) SID Lys in the BLL and BLQ models, respectively (Figure 1).
Based on the best-fitting BLL and BLQ models, alternative estimated regression equations were:
Based on the BLL model:
ADG = 1.018 – 0.598 × (1.29 – Lys), if SID Lys < 1.29%,
ADG = 1.018, if SID Lys ≥ 1.29%.
Based on the BLQ model:
ADG = 1.025 – 0.820 × (1.47 – Lys)2, if SID Lys < 1.47%,
ADG = 1.025, if SID Lys ≥ 1.47%.
Figure 1. Fitted broken-line linear (BLL) and broken-line quadratic (BLQ) regression models on ADG as a function of increasing standardized ileal digestible (SID) Lys in 15- to 35-lb pigs. The maximum mean ADG was estimated at 1.29% (95% CI: 1.23, 1.35%) and 1.47% (95% CI: 1.31, 1.64%) SID Lys in the BLL and BLQ models, respectively.
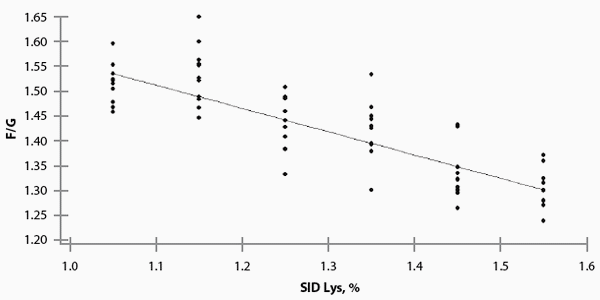
For F/G, the best fitting model was the LM (BIC: 658.1), whereas QP, BLL, and BLQ demonstrated less adequate fit (BIC: 660.8, 662.1, 661.4, respectively). The SID Lys level for maximum F/G was estimated as at least 1.55% (Figure 2). Based on the best fitting model, the estimated regression equation was:
F/G = 2.027 – 0.468 × (SID Lys)
Figure 2. Fitted linear (LM) regression model on F/G as a function of increasing standardized ileal digestible (SID) Lys in 15- to 35-lb pigs. The maximum mean F/G was estimated as at least 1.55% SID Lys.
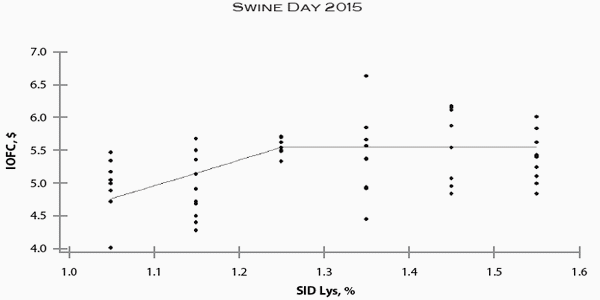
For IOFC, the best fitting model was the BLL (BIC: 110.8), whereas LM, QP, and BLQ demonstrated less adequate fit (BIC: 114.9, 113.9, 113.8, respectively). The maximum mean IOFC was estimated at 1.25% (95% CI: 1.14, 1.36%) SID Lys (Figure 3). Based on the best fitting model, the estimated regression equation was:
IOFC = 5.533 – 3.93 × (1.25 – Lys), if SID Lys < 1.25%,
IOFC = 5.533, if SID Lys ≥ 1.25%.
Figure 3. Fitted broken-line linear (BLL) regression model on IOFC as a function of increasing standardized ileal digestible (SID) Lys in 15- to 35-lb pigs. The maximum mean IOFC was estimated at 1.25% (95% CI: 1.14, 1.36%) SID Lys.
In conclusion, the estimated SID Lys required for maximum mean ADG was lower than that required for maximum mean F/G. Based on the NRC (2012) models, the estimated requirement for SID Lys for 15 to 35 lb pigs is 1.30% SID Lys, which nearly agrees with our findings for ADG, but may underestimate the requirements of maternal line barrows for F/G. It is important to note that the NRC (2012) estimates do not discriminate among requirements for ADG and F/G. This illustrates that different response variables can result in different estimates of the requirements. Although higher levels of SID Lys improved growth performance, at least 1.25% SID Lys was needed to maximize IOFC.
This article was originally published in Kansas Agricultural Experiment Station Research Reports: Vol. 1: Iss. 7. https://doi.org/10.4148/2378-5977.1113. This is an Open Access article licensed under a Creative Commons Attribution 4.0 License.


.jpg&w=3840&q=75)