1. Introduction
Mycotoxins are among the most important food safety hazards, based on their presence in agricultural commodities and their potential health impacts (Gruber-Dorninger, Jenkins, & Schatzmayr, 2019; Miraglia, De Santis, & Brera, 2008). A recent study confirms the (earlier) FAO estimate of 25% of mycotoxin occurrence being above European Commission and/or Codex threshold limits, while the prevalence of detectable mycotoxins is up to 60%–80% in all food and feed crops globally in 2020 (Eskola et al., 2020). Mycotoxins can lead to acute poisoning symptoms and physical damage to animal (Bertero, Moretti, Spicer, & Caloni, 2018) and human (International Agency for Research on Cancer (IARC), 2012; Marroquín-Cardona, Johnson, Phillips, & Hayes, 2014; Mitchell, Riley, Egner, Groopman, & Wu, 2017). Some fungal species can produce more than one mycotoxin, and some specific mycotoxins can be produced by different fungal species. Indeed, co-contamination of agricultural commodities with multiple mycotoxins is frequently observed (Smith, Madec, Coton, & Hymery, 2016). Multi-mycotoxin contamination is, therefore, also expected in products destined for human and animal consumption (van der Fels-Klerx, Liu, & Battilani, 2016). With climate change, the presence of mycotoxins in agricultural crops is expected to further increase (Tirado, Clarke, Jaykus, McQuatters-Gollop, & Frank, 2010; Van de Perre, Jacxsens, Liu, Devlieghere, & De Meulenaer, 2015; van der Fels-Klerx, Liu, & Battilani, 2016; Van der Fels-Klerx, Vermeulen, Gavai, & Liu, 2019).
Wheat (triticum. aestivum) is one of the most important feed and food crops worldwide. Around 26 million hectares of common wheat are yearly grown in Europe (data from FAOStat, at http://faostat3.fao. org/home/E). Wheat yields are estimated to increase by about 20% by 2030 as the global population increases (Bruinsma, 2003). Wheat can be susceptible to fungal infection and mycotoxin contamination during its critical growing period (flowering to harvest), under opportune environmental conditions, related to temperature, rain, and humidity. Given the frequent occurrence of mycotoxins in wheat, such as related to deoxynivalenol (DON) and zearalenone (ZEN), and its negative health and economic consequences, early prediction of the occurrence of mycotoxins in wheat is crucial to provide reliable and timely advice for cereal collectors and processors as well as food safety authorities. These stakeholders can use mycotoxin predictions to manage the contamination in wheat-based food and feed supply chains, and limit the contamination in wheat derived end products.
Mycotoxin prediction models make use of weather data, crop phenology data, and in some cases also agronomical data. Weather variables such as relative humidity, temperature, and rainfall, have proven to impact the presence of Fusarium Head Blight in wheat (Birr, Verreet, & Klink, 2019; El Jarroudi et al., 2020; Xiao et al., 2020) and DON contamination in winter wheat (Liu, Manstretta, Rossi, & Van der Fels-Klerx, 2018). Phenological variables such as flowering date, harvest date, sowing date, as well as agronomic variables such as soil type, crop variety, and crop rotation, also have been shown to impact DON contamination in winter wheat (Liu, Manstretta, Rossi, & Van der FelsKlerx, 2018; van der Fels-Klerx, Burgers, & Booij, 2010). Fungal infection in wheat usually results in changes in morphology, such as changes in the leaf color. Thus, satellite images derived from multi-source remote sensing have recently been investigated to reflect the wheat growth conditions, such as biophysical properties and disease stress (Chen, Wang, Yang, & Ma, 2017; Rokni & Musa, 2019). Some band values (Red, Green, NIR) and other vegetation indices (VIs) have been applied to monitor and/or predict plant diseases, such as bacterial leaf blight (Yudarwati, Hongo, Sigit, Barus, & Utoyo, 2020), powdery mildew disease (Zhang, Yuan, Nie, Wei, & Yang, 2014) and Fusarium Head Blight (Xiao et al., 2020).
In previous studies aimed at developing prediction models for mycotoxins in wheat, different types of modeling have been applied. Till today, most studies have applied statistical (empirical) modeling using weather and agronomical variables as input (Prandini, Sigolo, Filippi, Battilani, & Piva, 2009). In addition, mechanistic modeling, based on the fungal infection cycle, has been used for predicting Fusarium spp. and DON contamination of wheat (Rossi, Giosu`e, & Delogu, 2003; Rossi, Giosu`e, Pattori, Spanna, & Del Vecchio, 2003). Only a few studies have applied machine learning (ML) model approaches for the prediction of mycotoxins. Recently, Liu et al. (2018) performed a comparison among an empirical model, a mechanistic model, and a Bayesian network (BN) model for the prediction of DON in wheat. The authors concluded that the highest prediction performance of the model could be obtained by using BN modeling as compared to empirical and mechanistic modeling, in particular, to predict the high DON contamination (high-risk level).
Xiao et al. (2020) compared the Relevance Vector Machine (RVM) and the Logistic model for the prediction of Fusarium Head Blight in wheat. Authors reported that RVM performs well on a small number of samples, but the universality of parameters of this kind of model is not high, implying the parameters of the model will be different with changes in both time and space. They suggested further research should consider using deep learning techniques as well as a large dataset as input. Camardo Leggieri et al. (Camardo Leggieri, Mazzoni, & Battilani, 2021) used an ML approach to predict aflatoxin B1 (AFB1) and fumonisins (FBs) in maize, using cropping system factors as input variables. Their argument for applying ML was that conventional statistical methods were not suitable for the task at hand.
This study aimed to explore the use of a machine learning algorithm for the prediction of the risk levels of mycotoxins in wheat on a regional basis in Europe, using weather data, crop phenological data, and satellite images as input. To our knowledge, this is the first study that 1) predicts multi-mycotoxin contamination of a crop in the same model and 2) incorporates satellite image data with weather and crop phenological data to predict the occurrence of chemical food safety hazards in crops.
2. Methods
2.1. Data
Four types of data were used in this study: mycotoxin monitoring data, wheat phenology data, weather data, and satellite images. Considering the most sensitive stages of fungal infection and mycotoxin contamination of wheat, these data were selected for the period of wheat flowering till maturing each year. Data were pre-processed for the modeling steps and then combined into one dataset, by linking data based on grid (25 × 25 km) and year.
2.1.1. Mycotoxin data
Mycotoxin data used in this study include 11 years (2010–2020) of historical monitoring data for the presence of mycotoxins in wheat cultivated in Europe (3115 records in total). Six types of mycotoxins are included: DON, ZEN, T-2 toxin and HT-2 toxin (T2 + HT2), FBs, AFB1, and ochratoxin A (OTA). These data include a) field survey data for the presence of DON in wheat in the Netherlands (112 records) at 6 digits zip code level (van der Fels-Klerx, Burgers, & Booij, 2010; van der FelsKlerx, Focker, De Rijk, & Liu, 2021), b) monitoring results in Europe from a grain trader association (185 records) at country level, and c) monitoring results from the Dutch official control program for animal feed, as far as concerns mycotoxins (2818 records), at country level. The field survey data (a) were collected via identical questionnaires over the entire study period, which were distributed among commercial farmers. Participating farmers were asked to record agronomic and wheat phenology information about their wheat field, and to collect a sample of 1 kg of wheat kernels collected from the combine at harvest of the field. Samples were analyzed at Wageningen Food Safety Research (WFSR) for the presence of DON, using LC-MS/MS with different limits of quantification (LOQ) for each mycotoxin. In addition, locations of wheat fields in the Netherlands were collected per year from 2013 to 2020 from the platform PDOK (https://www.pdok.nl/) which provided high-quality geodata related to wheat fields. Data (b) were from one large grain trader organization covering monitoring results for mycotoxins in wheat. Wheat samples were collected shortly after harvest in Europe. Samples were analyzed at commercial laboratories using mostly LC-MS/MS and some cases ELISA for the presence of several mycotoxins. In the course of the Dutch official control program for animal feed (c), every year, a predefined number of samples are collected from different feed ingredients, including unprocessed wheat. Samples are sent to WFSR for analyses of multiple mycotoxins, using LC-MS/MS. Obtained mycotoxin monitoring data from the three sources include the following information: sampling date, crop type (winter wheat in this case), country of origin (cultivation) of the wheat, specific location or postal code of the wheat, mycotoxin type, the respective limit of quantification (LOQ) of the analytical method used for each mycotoxin (max LOQ for each mycotoxin could be applied as standard according to different requirements), and the mycotoxin concentration (in mg/kg). For each of the considered six mycotoxins in wheat, the European Commission (EC) legal maximum limit for aflatoxins, and respective guidance values for the remaining mycotoxins in feed were added to the dataset. The maximum limit for the presence of aflatoxins in wheat intended for animal feed was derived from Commission Regulation No 574/2011, and the guidance values for the presence of the other mycotoxins in wheat as animal feed or cereal products were derived from Commission Recommendations (Commission Regulation, 2010; European Commission, 2006, 2013). Since there is no guidance value for the presence of FBs in wheat, the guidance value for maize was considered. The EC maximum limit for aflatoxins (0.02 mg/kg for AFB1) and the guidance value for the other mycotoxins (60 mg/kg for FBs, 8 mg/kg for DON, 2 mg/kg for ZEN, 0.25 mg/kg for OTA, 0.1 mg/kg for T2 + HT2) were linked to the respective mycotoxins.
The majority (90%) of the monitoring results referred to mycotoxin concentrations that were below the respective LOQ of the analytical methods used, and 99% referred to concentrations below the respective EC maximum limit or guidance value. Due to this unbalanced nature of the mycotoxin concentration data, the tenth of the respective maximum limit or guidance value for the mycotoxins were used as the threshold to keep the data more balanced for model development (another threshold or legislative limit could be applied based on different requirements). Mycotoxin concentrations below the respective LOQ1 were set at zero to calculate averages. The yearly average concentration of each mycotoxin in wheat and the corresponding contamination level were calculated at the grid level (25 km × 25 km) by using location information in the database (such as country, province, city, or postal code). The contamination level of each mycotoxin was determined as three levels: low (≤respective limits of quantification (LOQ), set at zero), medium (> LOQ and < respective threshold value), and high (≥respective threshold value).
For data description, the 11-years average concentration (2010–2020) of each mycotoxin in wheat grown in each country was calculated, and the corresponding contamination level (low, medium, high) was determined to describe the overall contamination condition over the 11 years at the country level.
2.1.2. Crop phenology data
Wheat phenology variables flowering dates (FD) and full maturation dates were estimated using the WOFOST (WOrld FOod STudies) model developed under the EU Monitoring Agricultural ResourceS (MARS) project (Supit & van der E, 2003). These two variables were calculated using the WOFOST outputs emergence date and temperature sum (TSUM) per grid cell (25 km × 25 km) from 2010 to 2020 in Europe. TSUM1 is the accumulated daily average temperature from wheat emergence until wheat flowering. TSUM2 is the accumulated daily average temperature from the wheat flowering till full maturation. The full maturation date was used as the proxy for the wheat harvest date (HD). JRC temperature data from the MARS project were used. Gridded TSUM1 and TSUM2 values were then used to estimate wheat FD (using TSUM1) and HD (TSUM1 + TSUM2) for each grid cell. FD and HD were further used as the critical time window for the selection of weather data, and in the case of the Netherlands, also satellite images data.
2.1.3. Weather data
Daily weather data were derived from the European Commission Joint Research Centre (JRC) in Europe for the period 2010–2020. Data covered various meteorological variables from weather stations interpolated to 25 km × 25 km grids (same grid cells as crop phenology data) and are available via the Agri4Cast Data Portal (agri4cast.jrc.ec.europa. eu/DataPortal/). The derived daily weather variables included: maximum air temperature (˚C) (Maxt), minimum air temperature (˚C) (Mint), mean air temperature (˚C) (Meant), sum of precipitation (mm) (Sump), mean vapour pressure (hPa) (Vp), and mean relative humidity (%) (RH) calculated from vapour pressure and saturation vapour pressure (Allen, Pereira, Raes, & Smith, 1998). The daily weather data were used to calculate the weekly values of Maxt, Mint, Meant, Sump, and RH, for each week in the period FD to HD per grid. These weekly weather values per grid were used for model development.
2.1.4. Satellite data
Satellite images covering the sampling locations used in the field survey in the Netherlands were derived from Landsat 8 (L8) surface reflectance product (USGS Landsat 8 Collection 1 Tier 1 and Real-Time data OLI Raw Scenes) which provides long time-series spectral images with 16-day temporal resolution and 30 m spatial resolution including 9 bands2. Locations in the two other mycotoxin monitoring datasets were at the country level, and thus not detailed enough to link with satellite images. Spectral images from different periods were selected and tested in the model, such as monthly median band values of images from FD to HD. The period which gave the highest prediction performance was used in the final model. Band values were recalculated at the center (30 m × 30 m buffer zone) of wheat fields which were linked to the specific location of the wheat field in the Dutch mycotoxin monitoring dataset. Images data included 1840 records in total, which is the product of 112 records of DON concentration at the field (zip code) level and the number of wheat fields in each zip code area.
To reflect the growth conditions (crop biophysical properties and disease stress) of wheat, several original band values were selected (from band 1 to band 7) and three different vegetation indexes (VIs)3 were calculated, using band values, as spectral indicators. Calculated VIs included Normalized Difference Vegetation Index (NDVI), Green Normalized Difference Vegetation Index (GNDVI), and Normalized Difference Water Index (NDWI). NDVI and GNDVI can be used to quantify vegetation greenness or to assess photosynthetic activity; NDWI can be used to describe crop water status (Cárdenas, Valencia, Velasquez, & Gonzalez, 2018; Gao, 1996). These original band values and three spectral indicators were then used as input variables for further model development.
The four datasets, being mycotoxin monitoring, crop phenology, weather, and satellite images, were linked per grid cell (25 km × 25 km grid) in Europe, per year (Fig. 1).
2.2. Machine learning module
For model development, the mycotoxin type (one out of the six mycotoxins) was selected as the input variable, and the contamination level, being one out of the three risk levels of low, medium, or high, per grid were provided as model output. Here, a low contamination risk means that all six mycotoxins in wheat in one grid are in the low contamination level; medium means that at least one mycotoxin is in the medium level (and the other ones in low or medium contamination level); and high means that at least one mycotoxin is in the high contamination level, i.e., above the upper threshold.
A machine learning module was developed to predict the presence of the different mycotoxins in wheat at the grid level in Europe, in three levels for the likelihood of the contamination (low, medium, high) using pre-processed weather variables (see Section 2.1), crop phenology, and – in case of the Netherlands – also spectral indicators (see Section 2.1) as input. The full linked dataset was divided into three sets by year for model training, internal validation, and external validation. The data from the years 2010–2018 was split randomly into a training set (80%) for model learning and a testing set (20%) for internal validation. Data from the years 2019 and 2020 were used for external validation only, to test the model prediction accuracy. In the next sections, the methods are described in the order of model development.
2.2.1. Model training
The random forest (RF) algorithm was applied to train the model using the model training dataset. RF is an ensemble tree-based model which is widely used by data scientists to deal with spatial data (Biau & Scornet, 2016). First, all variables were used for the development of a model that gives predictions for Europe. Then, as a case study, the model was run using weather variables or satellite data only for the Netherlands to test the individual influence of these two different types of data on model performance.
2.2.2. Model internal and external validation
The predicted mycotoxin contamination levels on the grid level in Europe were internally validated using the model testing set. Additionally, for the Dutch case study, prediction results were validated with the Dutch data in the testing set. The model was then run with the input variables of the external validation set. The predicted model results for 2019 and 2020 were compared with the analyzed mycotoxin data (per contamination level) in these two years, separately. Confusion metrics, accuracy, and generalization ability were used as evaluation criteria to evaluate the performance of the predictive model. Feature importance was calculated based on their importance (effect on the reduction of Gini impurity) for constructing the RF model (Menze et al., 2009). Feature importance refers to techniques that assign a score to input features based on how useful they are at predicting a target variable. The features for each node are selected with the criterion of Gini impurity, which indicates how the features of a dataset should split nodes to form the tree. If a feature contains “low risk” only from three risk levels (high, medium, and low), this feature greatly decreased the impurity of the split. For each feature, we can calculate how it decreases the impurity on average.
3. Results and discussion
3.1. Descriptive analysis: Mycotoxin contamination of wheat in 2010–2020
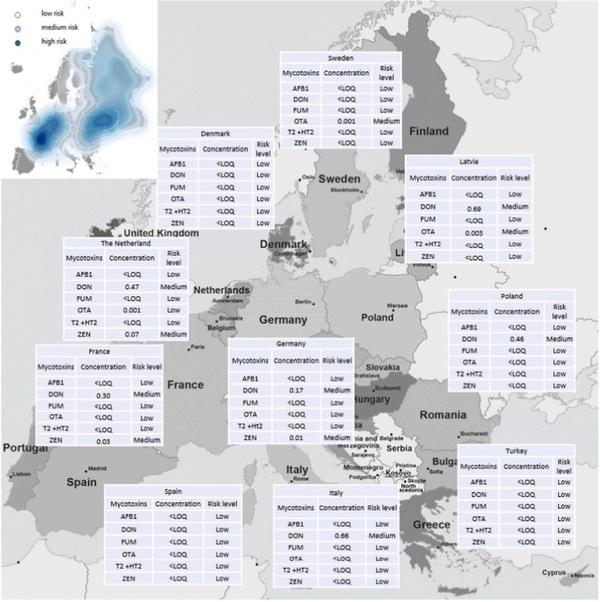
To describe the mycotoxin monitoring data used in this study, some examples of mycotoxin contamination levels and the 11-years average value of mycotoxin concentrations in wheat per grid in Europe in the period 2010–2020 are shown in Fig. 2. Countries in which wheat cultivation is common, i.e., France, Ukraine, and Germany (FAOStat), have medium contamination levels for some of the mycotoxins. Other countries with low wheat production, such as Denmark, Spain, and Turkey, show to have low mycotoxin contamination. FB, AFB1, and OTA usually do not occur in wheat grown in Europe. Indeed FB and AFB1 were not detected in wheat in concentrations above their LOQ. OTA was presented in a very low yearly average of 0.7 µg/kg. The reason that these 3 mycotoxins were included in this study is that 1) they were usually analyzed together using one analytical method, 2) this model is expected to be applied in the future when more data might be available.
3.2. Machine learning model with internal validation results
The prediction results of mycotoxin contamination (in levels) in wheat in Europe are presented in Fig. 3 as risk maps. These maps were developed using geo-referenced grid points to present the predicted mycotoxin contamination results. The model developed in this study gives an overall prediction accuracy of 0.90 using the internal testing dataset. The prediction accuracy for the high, medium, and low contamination levels were 0.91, 0.94, and 0.92, respectively (Fig. 4). The reason for the incorrect prediction results in the confusion matrix may be some unseen patterns in the testing dataset that were not learned during the model training step. The high prediction performance (0.90) is acceptable in this case, because avoiding overfitting and underfitting of the training and testing data is necessary to improve the generalization ability (meaning the stable prediction performance in the unseen data) of the model. The map with predicted mycotoxin levels (Fig. 3, left) has a similar pattern as the map with the measured mycotoxin concentrations (Fig. 3, right), which indicates a good spatial prediction performance of the developed model. Note that the size of the test dataset is less than 20% of the whole dataset (2010–2020) and, hence, the measured mycotoxin data in Fig. 3 (right) are not exactly similar to these data in the whole dataset (Fig. 2).
3.3. Internal validation results for the Netherlands case using 2010 – 2018 data
The median band value of spectral images in August gave the highest prediction performance of all images between FD and HD. The reason could be that the contamination in wheat was more obvious in images near HD. Therefore, the median band values of spectral images in August (2003–2020) with a cloud coverage of less than 10% were used in the final model for mycotoxin prediction. Fig. 5a shows the prediction results for mycotoxin contamination (low, medium, high) in wheat in the Netherlands using satellite data only. The prediction accuracies for high, medium, and low mycotoxin contamination levels were 0.56, 0.49, and 0.91, respectively. The total prediction accuracy of the model using only satellite data was 0.55. Due to the small amount of satellite data (1830 records), the prediction accuracy is not as high as when using weather data (Fig. 5b). Using weather variables only, the total prediction accuracy of the model for the Netherlands was 0.77. The model was then run with both satellite data and weather variables, resulting in an overall prediction accuracy of 0.81. Thus, results show that adding satellite data to the weather data could improve the overall mycotoxin prediction accuracy, as well as the accuracy for each contamination level.
The high prediction performance of the model emphasizes that mycotoxin contamination in wheat is mainly influenced by the weather.
Fig. 2. Average concentration of specific mycotoxin (mg/kg) (deoxynivalenol (DON), zearalenone (ZEN), T-2 toxin (T2) and HT-2 toxin (HT2), fumonisins (FBs), aflatoxin B1 (AFB1), and ochratoxin A (OTA)) and risk level in wheat between 2010 and 2020 in Europe. Levels considered are low (< respective limits of quantification (LOQ)), medium (≥LOQ and < respective threshold), and high (≥respective threshold).
Several combinations of the weather features, e.g., precipitation in two or three consecutive days when the temperature is between 15 and 25 ℃, had been used as model input variables. Results showed that adding these variables did not largely improve the model performance. The reason might be that the mycotoxin data were generated at the country level whereas the weather data were generated at the grid level. Having access to mycotoxin data collected from a smaller area could work better with these specific feature combinations. Although weather has an important role in predicting mycotoxin contamination, other factors are known to be relevant too. For example, geolocation of the fields (Liu, Manstretta, Rossi, & Van der Fels-Klerx, 2018; Torelli, Firrao, Bianchi, Saccardo, & Locci, 2012), fertilization, irrigation, pest control (Munkvold, 2014), the use of fungicides against Fusarium spp. around wheat flowering, crop rotation, and the use of resistant wheat cultivars (Liu, Manstretta, Rossi, & Van der Fels-Klerx, 2018; Torelli, Firrao, Bianchi, Saccardo, & Locci, 2012; van der Fels-Klerx, Focker, De Rijk, & Liu, 2021). However, an eight-year field survey in the Netherlands showed that DON levels in wheat could only be influenced to a little extent by agronomic practices (van der Fels-Klerx, Focker, De Rijk, & Liu, 2021). Additionally, these field specific (agronomic) information are hardly available to the scientific community for model development and can only be collected via field surveys with wheat farmers. Also, when the models are used in practice, this information is not often available to collectors, buyers, and food safety authorities, so input parameter values are unknown. The largely available mycotoxin monitoring data from the cereal collectors or national monitoring programs often also lack detailed sample location and/or sampling time. Since sample location and sampling time are the two linking pins between mycotoxin detection data and all other prediction variables, such as weather and satellite images, this information is very important to register in the future.
To our knowledge, the current study is the first one utilizing satellite images for multi-mycotoxin predictions. Many studies have paved the way to identify plant diseases with high resolution satellite images. Lin and co-authors indicated that the high resolution multispectral imagery with proper classification techniques can be a useful tool for mapping powdery mildew in winter wheat (Yuan et al., 2014). Satellite images have shown large potential in accurately detecting and quantifying the incidence of wheat streak mosaic virus over large areas in the United States (Mirik et al., 2011). This type of data offers a repeatable and low cost solution during the wheat growing season. Satellite images with high spatial and temporal resolution can also provide more accurate wheat morphology, such as leaf color, and wheat phenology information, for specific fields.
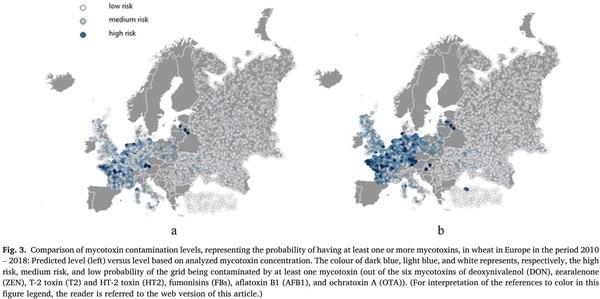
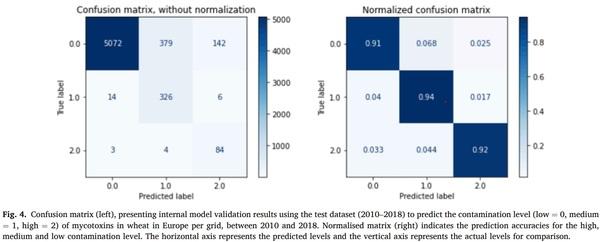
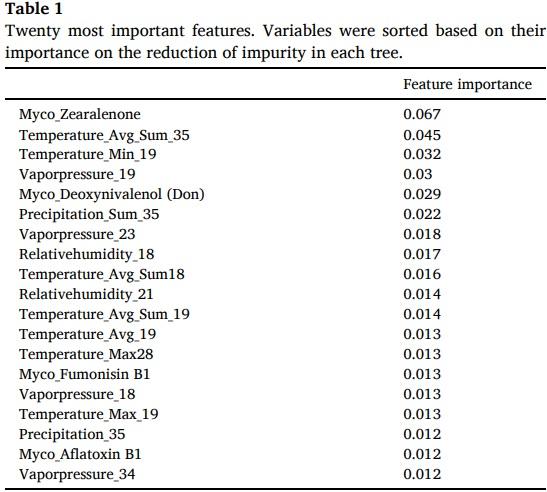
Table 1 presents the twenty most important features of the prediction model. The feature “myco_zearalenone” showed the highest feature importance. The detection ratio of high, medium, and low levels of zearalenone in wheat is 0: 0.15: 0.85. In comparison, the detection ratio for ochratoxin A is 0.05: 0.04: 0.9. As compared to the feature “myco_ochratoxin A”, the feature “myco_zearalenone” only contains medium and low risk levels, and it could greatly decrease the impurity of the split, resulting into a higher feature importance than the feature “myco_ochratoxin A”. From the six considered mycotoxins, ZEN, DON, and AFB1 were the most important mycotoxins for predicting the probability of co-contamination in one grid. From the weather variables, the sum of daily average temperature in the weeks 18, 19, and 35, the average of daily minimum temperature in week 19, the average of daily vapor pressure in week 18, 19 and 23, the sum of daily precipitation in week 18 and 35, and the average of daily relative humidity in week 18 and 21, were the most important ones. This result indicates, consistent with existing literature, that weather features around wheat flowering (FD) and around wheat maturation (HD) play an important role in the model. The date of wheat flowering (FD) and wheat maturation (HD) were calculated using the WOFOST model which has been applied operationally over the last 28 years as part of the MARS (Monitoring Agriculture with Remote Sensing) crop yield forecasting system (de Wit et al., 2019). The WOFOST model has been validated using the agrophenological database, which contains > 48,000 observational data records, with the key phenological stages of emergence, anthesis, and maturity, for winter soft wheat across Europe (Ceglar et al., 2019). The impact of delay in HD was not analyzed in our study, but Edwards and Jennings (2018) concluded that harvest delay (e.g. due to rainy weather) could result in increased DON and ZEN concentration of wheat.
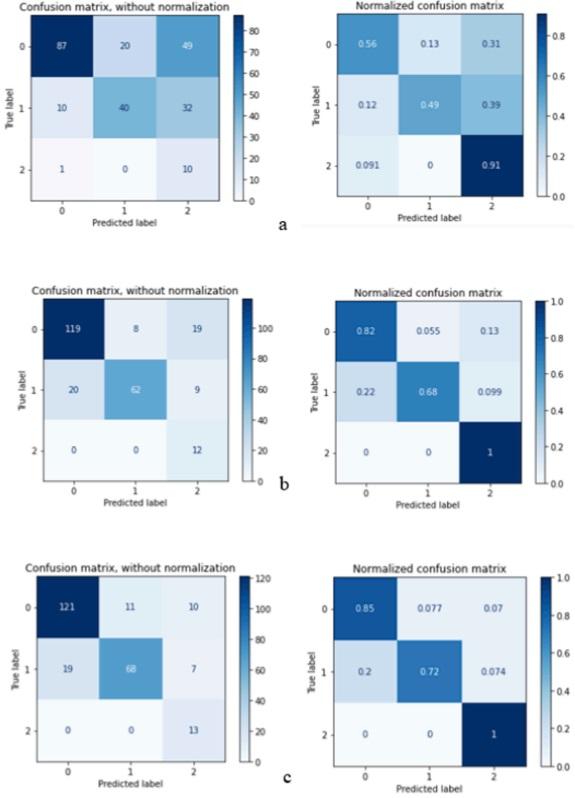
Fig. 5. a). Internal validation results of predicted DON contamination levels in wheat in the NL using satellite data only as predictor. Overall prediction accuracy was 0.55. b). Internal validation results of predicted DON contamination levels in wheat in the NL using weather data only. Overall prediction accuracy was 0.77. c). Internal validation results of predicted DON contamination levels in wheat in the NL using weather data and satellite data. Overall prediction accuracy was 0.81. The horizontal axis represents the predicted levels (low = 0, medium = 1, high = 2) and the vertical axis represents the actual levels for comparison.
3.4. External validation results of mycotoxin risk map in Europe in 2019 and 2020
Fig. 6 presents maps comparing the historical mycotoxin contamination and the predicted mycotoxin contamination using monitoring data in 2019 and 2020 (external validation). The map of predicted results almost overlapped with the map of monitoring data in 2019. The mycotoxin prediction accuracy of the model for the year 2019 was 0.99, and the accuracy in the year 2020 was 0.90. The accuracy of 0.90 in 2020 can be explained by the prediction performance being good for the low risk level, but so not good for the medium and high risk levels. The reason behind the lower prediction accuracy in 2020 as compared to 2019 may be some unseen patterns in 2020 that were not learned by the model training using data in 2010–2018. The solution could be to extend the training dataset (adding data in more years) to facilitate the model learning as many patterns as possible. In addition, when a larger dataset would be available, deep learning could be applied to improve the generalization ability of the model.
These results approved that machine learning algorithms can provide good prediction performance for the presence of mycotoxins in crops. A recent study of Camardo Leggieri and co-authors (Camardo Leggieri et al., 2021) concluded that the use of deep neural network algorithms to predict AFB1 and FBs in maize gave an accuracy of more than 75%, outperforming the weather-based mechanistic models AFLAmaize and FER-maize. Their argument for applying ML was that conventional statistical methods were not suitable for the task at hand. A combined approach of using mechanistic and Bayesian network modeling also showed high prediction accuracy for aflatoxins and fumonisins in Serbian maize (Liu et al., 2021). The obtained improvement in the above-mentioned studies is partly because machine learning algorithms can better deal with unbalanced datasets than statistical and empirical models.
The machine learning algorithm explored in this study predicts the probabilities of finding all mycotoxins concentration at low, at least one mycotoxin at medium, and at least one mycotoxin detection at the high contamination range at the regional scale in Europe with a high prediction accuracy. These prediction results provide buyers, collectors, and food safety authorities assistance in the management of mycotoxins in the wheat supply chain and risk-based testing. Given EC regulation 2017/625, food safety authorities need to apply more and more risk-based control (European Union, 2017). Regions with a predicted medium or high mycotoxin contamination level can be sampled and tested for the presence of mycotoxins more intensively than regions with a low predicted mycotoxin contamination level. The contamination level represents the probability of one or more of the six major mycotoxins being present, given the fact multiple mycotoxins are analyzed in one sample, using LC-MS/MS or other instrumental methods, in governmental monitoring programs. Collectors and buyers of wheat also can use the model predictions for deciding on testing frequencies, and they can use the predictions for routing and logistics in their wheat supply chain.
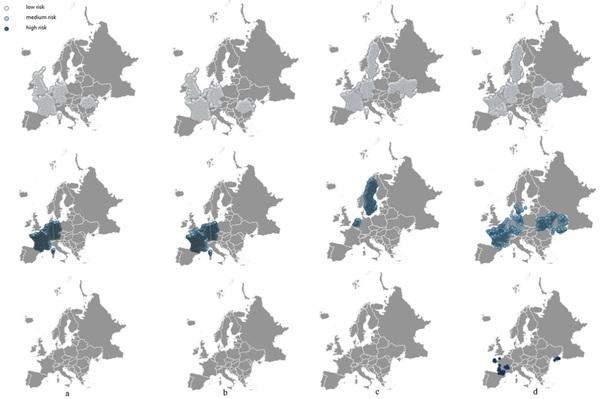
Fig. 6. a). Mycotoxin contamination levels in 2019 in Europe, b). Predicted mycotoxins contamination levels in 2019 in Europe, c). Mycotoxin contamination levels in 2020 in Europe, d). Predicted mycotoxin contamination levels in 2020 in Europe. The colour of dark blue, light blue, and white represents the high risk, medium risk, and low risk (level) of the location being contaminated by at least one mycotoxins. (For interpretation of the references to color in this figure legend, the reader is referred to the web version of this article.)
The case study on the prediction of DON contamination levels, based on data from the Netherlands, with the use of satellite data, in addition to weather data, shows the great potential of using satellite images in machine learning. When future more detailed satellite images become available, this provides a great asset to further improve the prediction models based on open source data (crop phenology, weather, and satellite). The availability of mycotoxin monitoring data, with detailed information on the location of crop cultivation, is most hindering in this regard, and thus the collection of such data should be prioritized.
4. Conclusions
This study used machine learning algorithms to predict the probability of one or more mycotoxins being present in wheat in Europe at the regional level. As a case study, the use of satellite images for the prediction of deoxynivalenol contamination in wheat in the Netherlands was tested as well. Results show high prediction performance of the Random forest algorithm, using weather data and wheat phenology as input. Internal validation showed 0.90 prediction accuracy, and external validation showed 0.90–0.99 prediction accuracy. Using satellite images only to predict deoxynivalenol contamination levels in wheat in the Netherlands resulted in average model performance, but combined with the weather data, it resulted in good prediction performance. It can be concluded that the use of machine learning algorithms for mycotoxin prediction in risk levels at the regional level in Europe provides good prediction results. Such models can be used by collectors, traders, and food safety authorities for logistics in the wheat supply chain, improved mycotoxin control, and risk-based testing. The use of satellite data is promising and needs to be explored with more data in future studies.
1 The respective LOQs were different for each mycotoxins depending on analytical methods used and years. In this dataset, the following LOQ were used for each mycotoxin: DON (0.2 and 0.5 mg/kg), ZEN (0.05 mg/kg), OTA (0.002 and 0.025 mg/kg), AFB1 (and 0.005 mg/kg), FBs (0.1mg/kg), T2+HT2 (0.04 mg/kg). We use two LOQ for both DON and OTA to the keep variations of concentration. The impact of using two LOQ for one toxin on calculating the average value for the distribution of contamiantion level was found to be small.
2 band 1 Visible (0.43–0.45 µm) 30 m, band 2 Visible (0.450–0.51 µm) 30 m, band 3 Visible (0.53–0.59 µm) 30 m, band 4 Red (0.64–0.67 µm) 30 m, band 5 Near-Infrared (0.85–0.88 µm) 30 m, band 6 SWIR 1(1.57–1.65 µm) 30 m, band 7 SWIR 2 (2.11–2.29 µm) 30 m.
3 GNDVI = (NIR-GREEN) /(NDVI+GREEN), NDWI=(NIRSWIR) / (NIR+SWIR), NDVI = (NIR – REDd) / (NIR + RED).
This article was originally published in Food Research International 159 (2022) 111588. https://doi.org/10.1016/j.foodres.2022.111588. This is an Open Access article under the CC BY-NC-ND license (http://creativecommons.org/licenses/bync-nd/4.0/). 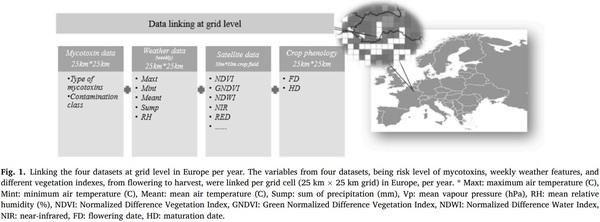
 van der Fels-Klerx")