INTRODUCTION
Mycotoxins are secondary metabolites produced by specific filamentous fungi that are common contaminants of agricultural commodities. The magnitude of the problem of mycotoxin contamination of agricultural commodities is demonstrated by Mannon and Johnson (1985) stating that one fourth of the grains produced worldwide are contaminated by mycotoxins. FAO has also estimated that worldwide about 25 per cent of crops are affected annually with mycotoxins (Jelinek et al. 1989). Aflatoxins belong to a group of toxins produced as secondary metabolites by fungi of the Aspergillus genus, especially Aspergillus flavus, Aspergillus parasiticus and Aspergillus nomius (Kurtzman et al., 1987). Aflatoxins and their isolated derivatives have more than 20 types of molecules. However, aflatoxin B1 , B2 , G1 and G2 are the most studied types and these are also the main naturally occurring compounds. Aflatoxin B1 produced by fungi in greater quantities than the others (Akande et al., 2006; Denli and Okan, 2006). Aflatoxins were first identified as the causative agent of Turkey X disease, which killed more than 100,000 turkey poults in England in 1960 (Lancaster et al. 1961). Aflatoxins are fluorescent substances with unique characteristics. Both aflatoxin B1 and B2 have a blue fluorescence and aflatoxin G1 and G2 have a green-yellow fluorescence under UV light. Aflatoxin B1 production is stimulated by higher temperatures relative to aflatoxins G1 . Optimal AFB1 production occurred between 24-28p C whereas 23p C is optimal for aflatoxin G1 formation (Weidenborner 2001). These aflatoxins listed in order of toxicity, from most toxic to least toxic are aflatoxin B1 , G1 , B2 and G2 . The toxicity of aflatoxins G1 , B2 and G2 is approximately 50, 20 and 10 per cent, respectively, comparative that of aflatoxin B1 when tested against various animal species (Smith and Ross 1991). Aflatoxin contamination of feed causes reduced feed quality and reduced feed efficiency either through poor conversion of nutrients or problems such as reproductive abnormalities (Oguz and Kurtoglu, 2000; Ortatalti et al., 2002). Aflatoxicosis in poultry also causes listlessness, anorexia with lowered growth rate, poor feed utilization, decreased egg production and increased mortality (Miazzo et al., 2000). Aflatoxins contamination can occur in a wide variety of feedstuffs including maize, sorghum, barley, rye, wheat, peanuts, soybean, rice, cottonseed and various derivative products made from these primary feedstuffs (Busby and Wogan 1979). The information on aflatoxin B2 , G1 and G2 content of poultry feed ingredients is scanty in the literature. Therefore, the present study was undertaken to survey the aflatoxins content of maize commonly used in poultry feeds.
MATERIALS AND METHODS
One hundred twenty (10 per month) sample spots were selected randomly in Bihar for collection of maize samples since maize is the most commonly used feed ingredient in poultry feeds. The samples were collected around 15th day of each month from January to December 2009. A sizeable quantity (200 g each) of the samples was collected, mixed thoroughly and stored in polythene bags for laboratory analysis. The samples were obtained from grain markets, selling agents, poultry farmers and poultry feed retailers. The maize samples were ground and subjected to chemical analysis in duplicate for the presence of various fractions of aflatoxin and total aflatoxin. The total aflatoxin contents were extracted from the maize samples as per the method given by Pons et al. (1966). Aflatoxin assays were performed by thin layer chromatography (TLC) by directly spotting few microlitres of the extracted samples on Silica Gel G prepared TLC plates. Plates were examined under ultraviolet light, and the various aflatoxin fractions were determined quantitatively by visual comparison with aflatoxin standards. The aflatoxin standards used in the present study were procured from M/s Sigma Co. (U.S.A.)/
RESULTS AND DISCUSSION
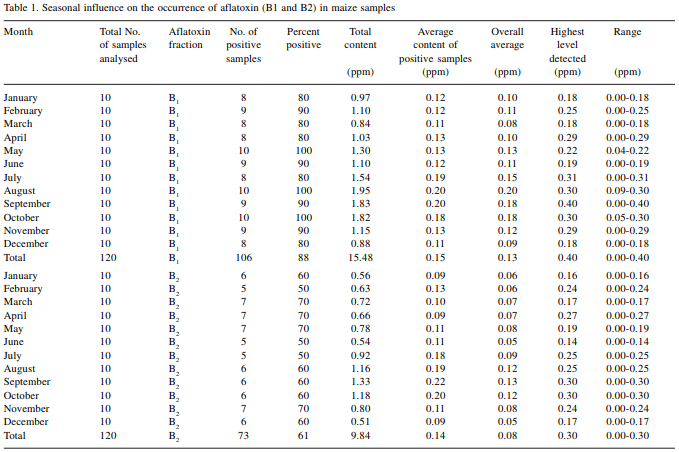
The maize samples were analysed for the presence of various aflatoxin fractions. The aflatoxin positive and average content of aflatoxin B fractions of maize samples are given in Table 1 and that of aflatoxin G fractions are given in Table 2. On qualitative estimation, these samples were found contaminated with aflatoxin B1 , B2 , G1 and G2 . These findings suggest that both Aspergillus flavus and Aspergillus parasiticus are probably involved in aflatoxin contamination of these samples since Aspergillus flavus is usually reported to produce only aflatoxin B1 and B2 , while Aspergillus parasiticus may produce aflatoxin G1 and G2 in addition to aflatoxin B1 and B2 as reported by Dorner et al. (1984). Out of 120 maize samples, 106 samples were found positive for aflatoxin B1 and 73 were found positive for aflatoxin B2 . The monthly percentage of aflatoxin B1 contamination varied from 80 to 100 and in the case of aflatoxin B2 , it varied from 50 to 70. In the months of May, August and October, all the samples were found positive for aflatoxin B1 . In the months of January, March, April, July and December 80 per cent of samples were found positive for aflatoxin B1 , whereas, in the months of February, June, September and November, 90 per cent of the samples were found positive for aflatoxin B1 . In the case of aflatoxin B2 , 70 per cent of the samples were found positive in the months of March, April, May and November, followed by 60 per cent in the months of January, August, September, October and December; and 50 per cent in the months of February, June and July.
The average content of aflatoxin B1 positive samples was the highest in the months of August and September (0.20 ppm) and lowest in the months of March and December (0.11 ppm). The average content of aflatoxin B2 positive samples was the highest in the month of September (0.22 ppm) and lowest in the months of January, April and December (0.09 ppm). The overall average content of aflatoxin B1 was the highest in the month of August (0.20 ppm) and lowest in the month of March (0.08 ppm). Similarly, the overall average content of aflatoxin B2 was the highest in the month of September (0.13 ppm) followed by August and October (0.12 ppm). The average content of aflatoxin B1 and B2 positive maize samples and the overall average contents of aflatoxin B1 and B2 were relatively higher in the months of July, August, September and October as compared to other months. The higher aflatoxin B contents in these months could be due to the warm and humid climatic conditions prevailing in the sampling region that are conducive to fungal growth and subsequent aflatoxin production. Eighty eight per cent of the maize samples were found to be positive for aflatoxin B1 and the values ranged from 0.00 to 0.40 ppm with an overall average of 0.13 ppm whereas, in the case of aflatoxin B2, 61 per cent of the samples were found to be positive for aflatoxin B2 and the values ranged from 0.00 to 0.30 ppm with an overall average of 0.08 ppm of aflatoxin B2.
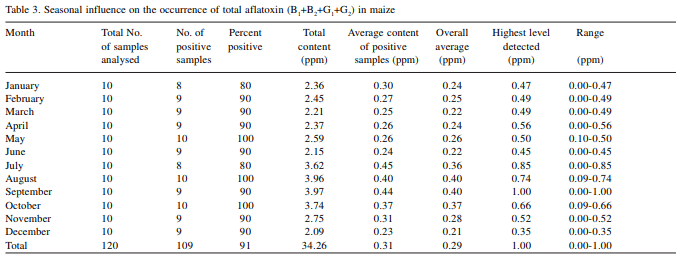
With regard to aflatoxin G fractions (Table 2), out of 120 maize samples, 48 samples were found positive for aflatoxin G1 and 45 samples were found positive for aflatoxin G2 .
The monthly percentage of aflatoxin G1 and G2 contamination varied from 20 to 60. The perusal of the data indicated that monthly percentage of aflatoxin G1 and G2 contamination was higher during winter months compared to other months. More than 50 per cent of the samples were found contaminated with aflatoxin G1 and G2 in the months of January, February, March, November and December whereas, less than 50 per cent of the samples were found contaminated with aflatoxin G1 and G2 in the months of April, May, June, July, August, September and October. Weidenborner (2001) reported that low temperatures (8-10p C) induce production of approximately equal amounts of aflatoxin B and G, however, total production is lowered and relatively more incubation period is required. Probably this could be the reason why the per cent contamination of maize samples was higher in colder months. The average content of aflatoxin G1 positive samples was the highest in the months of August (0.23 ppm) followed by September (0.21 ppm), October (0.18 ppm) and July (0.13 ppm). The average content of aflatoxin G2 positive samples was the highest in the months of August and September (0.20 ppm) followed by October (0.19) and July (0.12 ppm). As in the case of B fractions, the average content of aflatoxin G1 and G2 were higher in the months of July, August, September and October compared to those recorded in other months. Contrary to the aflatoxin B fractions, the overall average content of aflatoxin G1 and G2 remained almost similar throughout the year. Fourty per cent of the maize samples were found to be positive for aflatoxin G1 and the values ranged from 0.00 to 0.28 ppm with an overall average of 0.04 ppm whereas, in the case of aflatoxin G2 , 38 per cent of the samples were found to be positive for aflatoxin G2 and the values ranged from 0.00 to 0.26 ppm with an overall average of 0.04 ppm. Aflatoxin B1 was produced in greater quantity than aflatoxins B2 , G1 and G2 . Similar results were also reported by Akande et al., 2006 and; Denli and Okan, 2006.
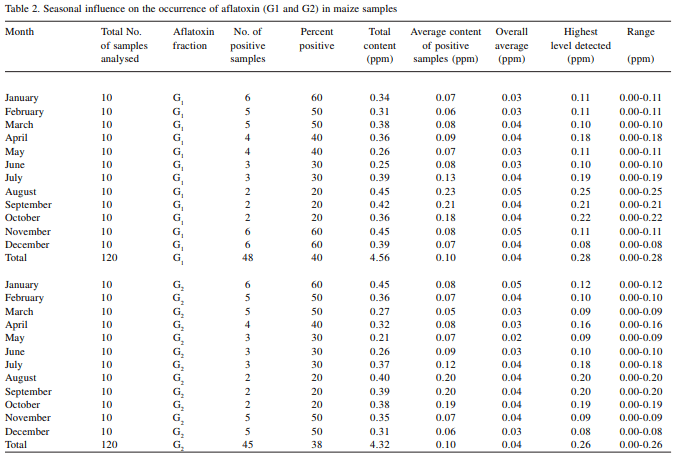
With regard to total aflatoxin (B1 +B2 +G1 +G2 ) content of maize samples (Table 3), out of 120 samples, 109 were found positive. The monthly percentage of total aflatoxin contamination varied from 80 to 100. In the months of May, August and October, all the samples were found contaminated with aflatoxins. Ninety per cent of the samples were found contaminated with aflatoxins in the months of February, March, April, June, September, November and December. However, eighty per cent of the samples were found contaminated with aflatoxins in the months of January and July. The average content of total aflatoxin positive samples were the highest in the month of July (0.45 ppm), followed by September (0.44), August (0.40 ppm) and October (0.37 ppm). The overall average content of total aflatoxin was the highest in the months of August and September (0.40 ppm), followed by October (0.37 ppm) and July (0.36 ppm). Ninety one per cent of the maize samples were found to be positive for total aflatoxin and the values ranged from 0.00 to 1.00 ppm with an overall average of 0.29 ppm.
It may be concluded that the average contents of aflatoxin positive samples were higher in the months of July, August, September and October as compared to other months. The overall average contents of B fractions and total aflatoxin contents were also higher in these months, whereas, the overall average contents of G fractions remained almost similar throughout the year. The percentage of G fractions contamination was relatively higher during winter months.
This article was originally published in Indian Journal of Poultry Science (2011) 46(3): 341-345.