Explore
Communities in English
Advertise on Engormix

Effects of Fusarium Mycotoxin Exposure on Lipid Peroxidation and Glutathione Redox System in the Liver of Laying Hens

Published: December 2, 2021
By: Szabina Kulcsár 1,2; Benjámin Kövesi 1; Krisztián Balogh 1,2; Erika Zándoki 2; Zsolt Ancsin 1; Balláné Erdélyi Márta 1 and Miklós Mézes 1,2 / 1 Department of Feed Safety, Gödöllo Campus, Institute of Physiology and Nutrition, Hungarian University of Agriculture and Life Sciences, Gödöllo, Hungary; 2 MTA-KE-SZIE Mycotoxins in the Food Chain Research Group, Institute of Physiology and Nutrition, Hungarian University of Agriculture and Life Sciences, Kaposvár, Hungary.
1. Introduction
Intensive agriculture and climate change can lead to the proliferation of microscopic fungi, which can cause severe economic and health damage through their toxin production. Fusarium species infect cereals, such as wheat, barley, oats, and maize, worldwide. According to the Biomin Worldwide Mycotoxin Survey [1], the percentage of positive samples of finished feeds in Europe was 65% for deoxynivalenol (DON) with an average of 268 µg/kg (maximum: 18,300 µg/kg), 36% for T-2 toxin with an average of 15 µg/kg (maximum: 296 µg/kg), and 64% for fumonisin B1 (FB1) with an average of 358 µg/kg (maximum: 11,210 µg/kg). The contamination of cereals with Fusarium toxins may cause feed-borne toxicosis in farm animals [2]. One of the most important groups of mycotoxins is the fusariotoxins. Based on their economic importance and practical occurrence, the most important members of this toxin family are DON, T-2 toxin, fumonisin B1, zearalenone, and their toxic metabolites [3]. As poultry feed is primarily based on maize, research on fusariotoxins needs to be extended to poultry breeds. There are different methods for decreasing the detrimental effects of mycotoxins. Among them, a well-known method is the use of adsorbents with the capacity to bind mycotoxins in the gastrointestinal tract [4]. This method successfully eliminates the risk of certain mycotoxins but is not effective for all of the mycotoxins relevant to the poultry industry. Biotransformation has been proven useful for the detoxification of mycotoxins by modification of mycotoxins into nontoxic metabolites [5].
Poultry species have different levels of resistance to mycotoxins. For instance, T-2 toxin is highly toxic [6], while DON is less toxic than T-2 toxin [7], and the poultry species are relatively tolerant to the toxic effects of FB1 [8].
In nature, several mycotoxins co-occur, so several mycotoxin interactions have recently been studied in in vivo and in vitro experiments. However, to estimate the nature of the interactions, we need to know the individual effects. Farm animals typically intake mycotoxins orally with feed, and mycotoxins induce abrasions and local inflammation through skin contact [9]. In broiler chickens, trichothecene mycotoxins have mainly nonspecific effects, such as genotoxic, cytotoxic, and immunomodulatory effects. Besides these, they harm the digestive system, liver, and nervous system, thereby reducing production traits [10]. T-2 toxin and DON metabolism may be initiated in the intestinal tract by certain microbial enzymes [11]. DON is converted to deepoxy DON (DOM-1), and T-2 toxin is converted to other metabolites, such as HT-2 toxin [11]. Trichothecene mycotoxins, such as T-2/HT-2 toxin and DON, have epoxide groups, making them particularly reactive compounds. This can be one possible explanation for their dermatotoxic effects [12]. T-2/HT-2 toxin and DON inhibit protein and DNA synthesis in eukaryotic cells [13] at the level of ribosomes [14]. Due to their inhibitory effect on protein synthesis, hematopoietic and lymphoid tissues are particularly sensitive to these mycotoxins [15]. T-2/HT-2 toxin and DON are well-known immunosuppressive compounds [16]. DON and T-2 toxin exposure decreased the antibody titer after vaccination against infectious bronchitis virus and Newcastle disease, reducing vaccination efficacy [17,18]. They also have a neurotoxic effect by influencing the signaling processes of cells [19] and are also emetic in this context [20].
Of the fumonisins discovered (fumonisin B1, B2, B3, etc.), FB1 is the most effective form from an animal and human health point of view. FB1 is structurally similar to sphingosine; therefore, it explicitly inhibits the enzyme ceramide synthetase, thus interfering with sphingolipid biosynthesis [21] and altering the metabolism of phospholipids and polyunsaturated fatty acids [22]. By inhibiting sphingolipid metabolism, fumonisins can cause cell damage and apoptotic cell death by damaging biological membranes. In addition, depletion of sphingolipids impairs the barrier function of cell membranes and increases the permeability of endothelial cells.
Oxidative stress and lipid peroxidation are well-known effects of trichothecene mycotoxins and fumonisin. T-2/HT-2 toxin and FB1, through the induction of lipid peroxidation processes, may reduce the function of liver microsomes [23], which in turn may inhibit the function of the xenobiotic transforming (cytochrome P450) system [24]. In xenobiotic transformation, besides the cytochrome P450 enzymes, the amount and activity of the biological antioxidant defense, specifically the glutathione redox system, can vary significantly depending on the degree of oxidative stress. Based on previous research [25,26], it can be said that in connection with biochemical changes in cells, trichothecene mycotoxins increase the intensity of lipid peroxidation processes, which affects the functioning of the biological antioxidant system. Results of several previous short-term studies showed that trichothecene mycotoxins induce lipid peroxidation and activate the glutathione redox system in broiler chicken but at high dose levels [27]. However, another previous study did not prove the effect of T-2 toxin on induction of lipid peroxidation even at the same dose range in broiler chicken [28]. The same contradictory results were found in DON and broiler chicken in long-term studies with high doses [29,30]. Initiation of lipid peroxidation by fumonisin B1 was found in a high dose in a long-term study with broiler chicken [31].
Based on the results mentioned above, the present study aimed to explore the effect of experimentally contaminated feeds with these mycotoxins individually during short-term oral exposure on the initiation and termination phases of lipid peroxidation in the liver, which is important in the metabolism and storage of mycotoxins and parallels with glutathione redox system activity. In addition, the relative expression of genes encoding certain enzymes of the glutathione redox system was also determined. However, there are still many questions that remain open about the effects of T-2 toxin, DON, and FB1, especially on the processes involved in the oxygen free radical formation and the mechanism of their effects on the glutathione redox system. Furthermore, the short-term effects of T-2 toxin, DON, and FB1 on birds are currently even less known, so we chose economically important laying hens as a model organism.
We already have a wealth of knowledge about the toxic effects of fusariotoxins based on changes in the parameters of individual biological processes and the mechanisms that regulate them. Still, much of this is based on in vitro model studies or in vivo, but usually sublethal, long-term studies. In the present study, the effects of fusariotoxins were investigated individually, which means that we can assess the mechanism of each mycotoxin. Still, it may provide a basis for multi-mycotoxin studies.
2. Materials and Methods
2.1. Mycotoxin Production
T-2 toxin was produced by Fusarium sporotrichioides (NRRL 3299), DON was produced by Fusarium graminearum (NRRL 5883), and FB1 was produced by Fusarium verticillioides (MRC 826) strain on corn substrate according to the method of Fodor et al. [32]. These strains primarily produce only those mycotoxins, but the presence of other mycotoxins should be considered moderately. Therefore, according to its measured mycotoxin content, an appropriate amount of the fungal culture was added to the poultry feed. The DON, 3-acetyl DON (3-AcDON), and 15-acetyl DON (15-AcDON) contents of the artificially contaminated and control feeds [33]; T-2/HT-2 toxin [34]; and FB1 [35] were measured by HPLC equipped with fluorescence detector after immune-affinity clean up. The control feed did not contain detectable amounts of T-2/HT-2 toxin, DON, or FB1. The predicted and measured mycotoxin contents of the feeds are shown in Table 1.
Effects of Fusarium Mycotoxin Exposure on Lipid Peroxidation and Glutathione Redox System in the Liver of Laying Hens - Image 1
2.2. Animals and Experimental Design
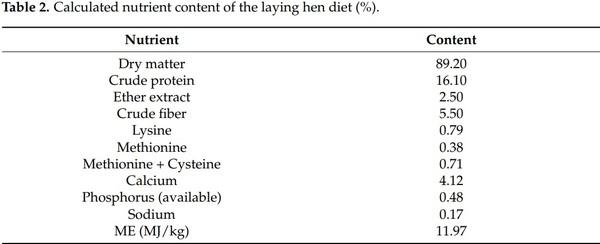
The experimental animals were Tetra SL laying hens (49 weeks of age, 90% average daily egg production, n = 78). Four groups were formed, one control and three treated groups, each containing 18 animals, and 6 animals were absolute control. Drinking water was provided ad libitum, but a restricted daily feeding protocol was used (150 g feed/day/bird). The calculated nutrient content of the laying hen diet is given in Table 2.
A short-term, 3-day, in vivo feeding trial, was performed using 2× the recommended mycotoxin content of poultry feed level in the EU [36]. The predicted doses were 0.5 mg/kg T-2/HT-2 toxin, 10 mg/kg DON, and 40 mg/kg FB1. However, according to a recent worldwide survey, these contamination levels may be present in animal feeds [1]. The control group was fed the same diet without experimental mycotoxin contamination, and its mycotoxin content was lower than the limit of quantification in the case of all three mycotoxins.
Effects of Fusarium Mycotoxin Exposure on Lipid Peroxidation and Glutathione Redox System in the Liver of Laying Hens - Image 2
Laying hens were kept in deep litter condition with natural light regimen (12 L/12 D). The experiment started after 12 h of feed deprivation. Six animals were sampled randomly at 0 h as absolute control, and six animals from each experimental group were sampled on days 1, 2, and 3. After cervical dislocation, liver samples were taken and were put into liquid nitrogen. Liver samples were stored at −70 °C until biochemical and gene expression studies.
The experiment was performed in accordance with the European Communities Council Directive (86/609 EEC). The experimental protocol was approved by the Food Chain Safety, Land Use, Plant and Soil Protection and Forestry Directorate of the Pest County Governmental Office (PE/EA/1964-7/2017).
2.3. Biochemical Analyses
The amount of reduced glutathione (GSH) and activity of glutathione peroxidase (GPx), as well as the markers of the initiation phase of lipid peroxidation, conjugated dienes (CDs) and conjugated trienes (CTs), and the terminal phase marker, the concentration of malondialdehyde (MDA), were measured in the liver homogenate (9-fold volume isotonic saline). Levels of CDs and CTs were determined after extraction of the lipid content of the liver with 2,2,4-trimethylpentane, and the absorbance of the CDs was measured at 232 nm, while that of the CTs was measured at 268 nm [37]. The MDA content was determined in an acidic medium by complex formation with 2-thiobarbituric acid [38]. Among members of the glutathione redox system, GSH content was measured according to Sedlak and Lindsay [39], and the activity of GPx was measured according to Lawrence and Burk [40]. GSH content and GPx activity were calculated to protein content of the 10,000 g supernatant fraction of liver homogenates, which was measured with Folin’s phenol reagent [41].
2.4. Gene Expression Studies with Quantitative Real-Time PCR
Total RNA was purified from 6–10 mg liver with NucleoZOL reagent (MachereyNagel, Düren, Germany), according to the manufacturer’s manual. Genomic DNA was removed from the purified RNA samples by DNase I (Thermo Fisher Scientific, San Jose, CA, USA) as proposed by the manufacturer. RNA concentration, purity, and integrity were examined in a 2% agarose gel using a NanoPhotometer (Implant, Munich, Germany), where samples for the OD 260/280 index above 2.0 were accepted. According to the recommended protocol, cDNA was generated from 1 µg of RNA per sample by random nonamer reverse transcription (RevertAID Reverse Transcriptase, Thermo Fisher Scientific, San Jose, CA, USA). Pools were created from the cDNA for each treatment group, from the same amount of cDNA per individual (n = 6), and those pooled samples were used for qPCR measurements. The expression of phospholipid hydroperoxide glutathione peroxidase (GPX4), glutathione synthetase (GSS), and glutathione reductase (GSR) target genes, as well as glyceraldehyde-3-phosphate dehydrogenase (GAPDH) as endogenous control gene, was examined by quantitative real-time PCR using the duplex qPCR method. The GAPDH gene as an endogenous control was selected based on literature data [42] because it has no interaction with oxidative stress or mycotoxins. Specific primers designed for the target and the household genes (Table 3) and dual-labeled (minor groove binder (MGB)) TaqMan probes labeled with different fluorescent dyes (Table 4) allowed the simultaneous analysis of two gene products. Primers and probes were designed using Primer Express 3.0.1 (Thermo Fisher Scientific, San Jose, CA, USA) software.
Effects of Fusarium Mycotoxin Exposure on Lipid Peroxidation and Glutathione Redox System in the Liver of Laying Hens - Image 3
Effects of Fusarium Mycotoxin Exposure on Lipid Peroxidation and Glutathione Redox System in the Liver of Laying Hens - Image 4
Measurements were performed with StepOnePlus real-time PCR system (Thermo Fisher Scientific, San Jose, CA, USA) using Maxima Probe qPCR Master Mix (1 × final concentration) (Thermo Fisher Scientific, San Jose, CA, USA) as described previously [43]. The VIC and FAM signals were read at 72 °C in each cycle at the end of the extension period. In addition, the specificity of the PCR product and the presence of primary dimers were checked by gel electrophoresis.
Ct values for both target and control genes were determined with StepOnePlus (v2.2) software (Thermo Fisher Scientific, San Jose, CA, USA), and delta Ct (∆Ct) and delta-delta Ct (∆∆Ct) values were calculated. Finally, the RQ (relative quantification; RQ = 2−∆∆Ct) values were calculated [44].
2.5. Statistical Analysis
Data are expressed as mean ± standard deviation (SD). GraphPad Prism 6.07 software (GraphPad Software, San Diego, CA, USA) was used for the statistical evaluation. Normality was confirmed with the Kolmogorov–Smirnov, test and the homogeneity of variance was confirmed with the Bartlett test. Data passing both tests were analyzed by one-way ANOVA and Tukey’s post hoc test (p < 0.05). Kruskal–Wallis test was used for pairwise comparisons (p < 0.05).
3. Results
3.1. Effect of T-2 Toxin, DON, and FB1 on Lipid Peroxidation Parameters in the Liver of Laying Hens
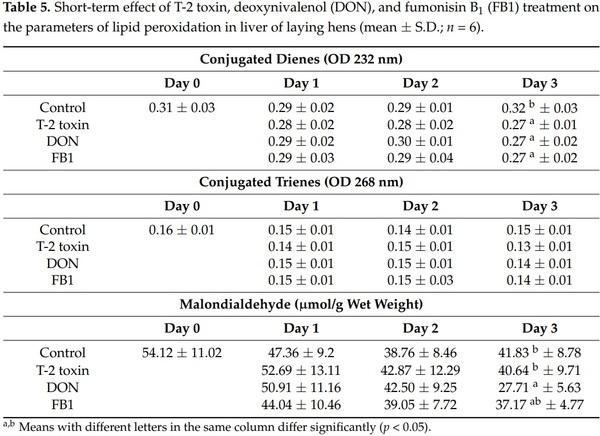
The levels of initiation phase markers, CDs and CTs, and terminal phase marker of lipid peroxidation, MDA concentration, are shown in Table 5. The CD levels were significantly (p < 0.05) lower as an effect of the short-term exposure with all three examined mycotoxins compared to the control. In addition, the MDA concentration was significantly (p < 0.05) lower in the liver of laying hens fed a DON-contaminated diet as compared to the control and T-2 toxin group at the end of the experiment (day 3). There were no significant differences in the amount of CT levels.
Effects of Fusarium Mycotoxin Exposure on Lipid Peroxidation and Glutathione Redox System in the Liver of Laying Hens - Image 5
3.2. Effect of T-2 Toxin, DON, and FB1 on Markers of the Glutathione Redox System in the Liver of Laying Hens
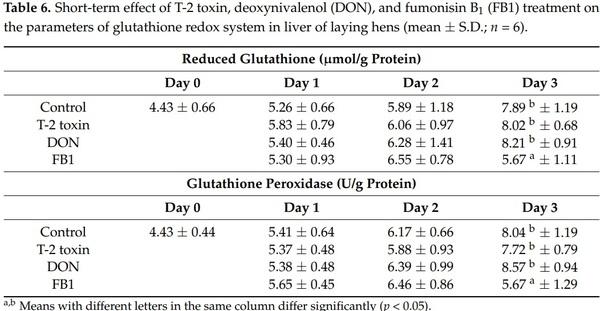
The amount of GSH and the activity of GPx were significantly (p < 0.05) lower compared to the control and the two trichothecene-treated groups on day 3 as an effect of FB1 (Table 6).
Effects of Fusarium Mycotoxin Exposure on Lipid Peroxidation and Glutathione Redox System in the Liver of Laying Hens - Image 6
3.3. Effect of T-2 Toxin, DON, and FB1 on the Relative Expression of the GPX4, GSS, and GSR Genes in the Liver of Laying Hens
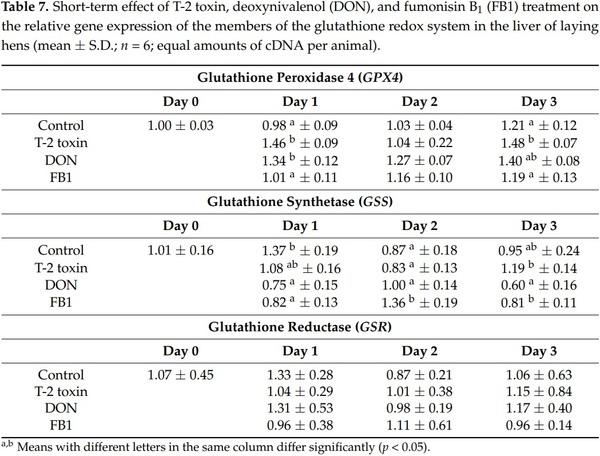
The relative gene expression of GPX4 was significantly elevated on day 1 and day 3 of T-2 toxin exposure (p < 0.05) and as an effect of DON (p < 0.05) on day 1 compared to the control and the FB1 groups. However, there was no gene activation in the FB1-treated group (Table 7). The gene expression of GSS was significantly lower on the first day in DON (p < 0.05) and FB1 (p < 0.05) groups than in the control group, but it was higher on day 2 in the FB1-treated group (p < 0.05) compared to the control and the two trichothecene-treated groups. On day 3, higher relative gene expression of GSS was found in the T-2 toxin-treated group (p < 0.05) compared to the other experimental groups (Table 7). There were no significant changes in the gene expression of GSR (Table 7).
Effects of Fusarium Mycotoxin Exposure on Lipid Peroxidation and Glutathione Redox System in the Liver of Laying Hens - Image 7
4. Discussion
The presence of mycotoxins that contaminate feed is one of the primary problems in the production of animal products; that is why it is particularly important to know their mechanism of action in the animal body. Three Fusarium mycotoxins, T-2 toxin, DON, and FB1, have a well-known effect on the activation of oxidative stress and lipid peroxidation, which the glutathione redox system can neutralize.
According to the results, none of the examined mycotoxins initiated measurable lipid peroxidation; possibly, the applied dose did not cause even mild oxidative stress in the liver of laying hens. On the contrary, a significant decrease in lipid peroxidation parameters, such as the CD levels, as an effect of all three examined mycotoxins and a significant decrease in MDA concentration as an effect of DON were observed. These decreases may be due to a change in the fatty acid composition of liver tissue lipids as the effect of the mycotoxin exposure, which has been detected previously as the effect of FB1 and T-2 toxins in rabbits [45]. The altered fatty acid composition can affect the sensitivity of lipids to oxidation by oxygen free radicals [46]. Markers of the glutathione redox system, amount of GSH, and activity of GPx were also decreased compared to the control at the end of the trial as an effect of FB1, but the T-2 toxin and DON did not have the same effect. This difference may be due to the rapid activation of the glutathione redox system as the effect of FB1, which effectively inhibited lipid peroxidation but resulted in a rapid depletion of the glutathione redox system. It seems that there was not enough time available for the regeneration of glutathione disulfide and de novo synthesis and/or post-translational activation of GPx. This result is supported by a previous study [47], where FB1 was found to decrease the GSH concentration in the liver because of the removal of free radicals as caused by oxidative stress. However, DON or T-2 toxin at the dose applied did not activate the glutathione system, possibly due to lack of even mild oxidative stress.
As a result of the mycotoxin exposure, significant differences were found in the relative expression of genes involved in regulating the glutathione redox system: induction for GPX4 in the group treated with T-2 toxin and DON after 24 h of mycotoxin exposure but not in the FB1-treated group. This result suggested that the trichothecene mycotoxins, T-2 toxin, and DON rapidly activated the antioxidant defense system at the gene expression level, preventing further lipid peroxidation processes even if the given mycotoxins otherwise induce the formation of reactive oxygen species (ROS). On the other hand, FB1 did not activate the glutathione redox system at gene expression level in all cases, suggesting tolerance for the applied dose of FB1 in laying hens. However, the relative expression of the GSS gene increased in the liver of laying hens on day 2 in the FB1-treated group and on day 3 as an effect of T-2 toxin. According to the differences in the changes of relative gene expression, T-2 toxin and DON at the dose applied induce a rapid ROS formation and then a rapid and effective antioxidant response. At the same time, FB1 induces less ROS formation; therefore, the relative expression of not all of the glutathione redox system encoding genes increased. These results suggest that short-term mycotoxin exposure reached the threshold for activation of the expression of some, but not all, of the antioxidant genes. Still, it was detectable only at the mRNA level, not at the activity level, during the 3-day trial.
These results can be helpful for multi-mycotoxin examinations, as these mycotoxins frequently co-occur in feedstuffs, and combined exposure might cause additive, synergistic, or antagonistic toxic reactions. Short-term effects of T-2 toxin, DON, and FB1 in poultry are not fully described yet, and their effects on ROS formation are contradictory. The burning question is still open: how long of a period is required after DON, T-2 toxin, and FB1 uptake for the significant changes at the cellular level to elevate oxidative stress? Further studies are required to investigate the order of the response of biochemical and molecular markers of oxidative stress in the case of multi-mycotoxin exposure.
5. Conclusions
In conclusion, short-term and relatively low-dose T-2 toxin, DON, and FB1 exposure reduced lipid peroxidation by the 72nd hour of the experiment. The results show that the mycotoxins used might have influenced the fatty acid composition of the membrane phospholipids and thus their susceptibility to oxidation. Furthermore, the examined mycotoxins affected the relative gene expression of the genes encoding the enzymes of the glutathione redox system, but this effect did not manifest at the level of GSH amount and GPx activity. Thus, the results suggest that the doses applied did not cause oxidative stress in laying hens or were effectively eliminated by the glutathione redox system.
   
This article was originally published in Antioxidants 2021, 10, 1313. https://doi.org/10.3390/antiox10081313. This is an Open Access article distributed under the terms and conditions of the Creative Commons Attribution (CC BY) license (https://creativecommons.org/licenses/by/4.0/).

1. Biomin. World Mycotoxin Sur. 2020. Available online: https://www.biomin.net/downloads/2020-biomin-world-mycotoxinsurvey-report (accessed on 10 July 2021).
2. Sokolovic, M.; Garaj-Vrhovac, V.; Simpraga, B. T-2 toxin incidence and toxicity in poultry. Arh. Hig. Rada. Toksikol. 2008, 59, 43–52.
[CrossRef] [PubMed]
3. Nesic, K.; Ivanovic, S.; Nesic, V. Fusarial toxins: Secondary metabolites of Fusarium fungi. Rev. Environ. Contam. Toxicol. 2014,
228, 101–120.
4. Magnoli, A.; Monge, M.; Milazzo, R.; Cavaglieri, L.; Magnoli, C.; Merkis, C.; Cristofolini, A.; Dalcero, A.; Chiacchiera, S. Effect of low levels of aflatoxin B1 on performance, biochemical parameters, and aflatoxin B1 in broiler liver tissues in the presence of monensin and sodium bentonite. Poult. Sci. 2011, 90, 48–58. [CrossRef]
5. Grenier, B.; Bracarense, A.P.F.; Schwartz, H.E.; Lucioli, J.; Cossalter, A.-M.; Moll, W.D.; Schatzmayr, G.; Oswald, I.P. Biotransformation approaches to alleviate the effects induced by Fusarium mycotoxins in swine. J. Agric. Food Chem. 2013, 61, 6711–6719.
[CrossRef]
6. Danicke, S. Prevention and control of mycotoxins in the poultry production chain: A European view. World Poult. Sci. J. 2002, 58,
451–474. [CrossRef]
7. Danicke, S.; Gareis, M.; Bauer, J. Orientation values for critical concentrations of deoxynivalenol and zearalenone in diets for pigs, ruminants and gallinaceous poultry. Proc. Soc. Nutr. Physiol. 2001, 10, 171–174.
8. Bermudez, A.J.; Ledoux, D.R.; Rottinghaus, G.E. Effects of Fusarium moniliforme culture material containing known levels of fumonisin B1 in ducklings. Avian Dis. 1995, 39, 879–886. [CrossRef] [PubMed]
9. Swanson, S.P.; Helaszek, C.; Buck, W.B.; Rood, J.H.D.; Haschek, W.M. The role of intestinal microflora in the metabolism of trichothecene mycotoxins. Food Chem. Toxicol. 1988, 26, 823–829. [CrossRef]
10. Szilágyi, M.; Fekete, S.; Huszenicza, G.Y.; Albert, M. Biochemical and physiological effects of long-term sublethal T-2 toxin feeding in rabbits. Acta. Biol. Hung. 1994, 45, 69–76.
11. Wu, Q.; Dohnal, V.; Huang, L.; Kuca, K.; Yuan, Z. Metabolic pathways of trichothecenes. Drug Metab. Rev. 2010, 42, 250–267.
[CrossRef]
12. Ehling, G.; Cockburn, A.; Snowdon, P.; Buschhaus, H. The significance of the Fusarium toxin deoxynivalenol (DON) for human and animal health. In Proceedings of the V. European Fusarium Seminar, Szeged, Hungary, 29 August–5 September 1997.
13. Holladay, S.D.; Smith, B.J.; Luster, M.I. B-lymphocyte precursor cells represent sensitive targets of T2 mycotoxin exposure. Toxicol.
Appl. Pharmacol. 1995, 131, 309–315. [CrossRef]
14. Ueno, Y.; Nakajima, M.; Sakai, K.; Ishii, K.; Sato, N.; Shimada, N. Comparative toxicity of trichothecene mycotoxins: Inhibition of protein synthesis in animal cells. J. Biochem. 1983, 74, 285–292.
15. Kidd, M.T.; Hagler, W.M.; Qureshi, M.A. Trichothecene mycotoxins depress the mononuclear-phagocytic system of young turkeys.
Immunopharmacol. Immunotoxicol. 1995, 17, 385–398. [CrossRef] [PubMed]
16. Dänicke, S.; Ueberschär, K.H.; Valenta, H.; Matthes, S.; Matthäus, K.; Halle, I. Effects of graded levels of Fusarium-toxincontaminated wheat in Pekin duck diets on performance, health and metabolism of deoxynivalenol and zearalenone. Br. Poult.
Sci. 2004, 45, 264–272. [CrossRef]
17. Harvey, R.B.; Kubena, L.F.; Huff, W.E.; Elissalde, M.H.; Phillips, T.D. Hematologic and immunologic toxicity of deoxynivalenol (DON)-contaminated diets to growing chickens. Bull. Environ. Contam. Toxicol. 1991, 46, 410–416. [CrossRef]
18. Dänicke, S.; Ueberschär, K.H.; Halle, I.; Matthes, S.; Valenta, H.; Flachowsky, G. Effect of addition of a detoxifying agent to laying hen diets containing uncontaminated or Fusarium toxin-contaminated maize on performance of hens and on carryover of zearalenone. Poult. Sci. 2002, 81, 1671–1680. [CrossRef]
19. Leathwood, P.D. Tryptophan availability and serotonin synthesis. Proc. Nutr. Soc. 1987, 46, 143–146. [CrossRef]
20. Fioramonti, J.; Dupuy, C.; Dupuy, J.; Bueno, L. The mycotoxin, deoxynivalenol, delays gastric emptying through serotonin-3 receptors in rodents. J. Pharmacol. Exp. Ther. 1993, 266, 1255–1260.
21. Leathwood Kim, M.Y.; Linardic, C.; Obeid, L.; Hannun, Y. Identification of sphingomyelin turnover as an effector mechanism for the action of tumor-necrosis-factor-alpha and gamma-interferon -specific role in cell differentiation. J. Biol. Chem. 1991, 266,
484–489.
22. Gelderblom, W.C.A.; Jaskiewicz, K.; Marasas, W.F.O.; Thiel, P.G.; Horak, R.M.; Vleggaar, R.; Kriek, N.P.J. Fumonisins—Novel mycotoxins with cancer-promoting activity produced by Fusarium moniliforme. Appl. Environ. Microbiol. 1988, 54, 1806–1811.
[CrossRef] [PubMed]
23. Guerre, P.; Eeckhoutte, C.; Burgat, V.; Galtier, P. The effects of T-2 toxin exposure on liver drug metabolising enzymes in rabbit.
Food Addict. Contam. 2000, 12, 1019–1026. [CrossRef] [PubMed]
24. Mézes, M.; Virág, G.Y.; Barta, M.; Abouzeid, A.D. Effect of lipid peroxide loading on lipid peroxidation and on the glutathione and cytochrome systems in rabbits. Acta Vet. Hung. 1996, 44, 443–450.
25. Mézes, M.; Barta, M.; Nagy, G. Comparative investigation on the effect of T-2 mycotoxin on lipid peroxidation and antioxidant status in different poultry species. Res. Vet. Sci. 1988, 66, 19–23. [CrossRef]
26. Sure, P.F.; Dvorsky, J.E.; Sparks, N.H.C.; Jaques, K.A. Impact of mycotoxins on the body’s antioxidant defence. In Nutritional
Biotechnology in the Feed and Food Industries.; Lyons, T.P., Jaques, K.A., Eds.; Nottingham University Press: Nottingham, UK, 2002; pp. 131–142.
27. Bócsai, A.; Pelyhe, C.S.; Zándoki, E.; Ancsin, Z.S.; Szabó-Fodor, J.; Erdélyi, M.; Mézes, M.; Balogh, K. Short-term effects of T-2 toxin exposure on some lipid peroxide and glutathione redox parameters of broiler chickens. J. Anim. Physiol. Anim. Nutr. 2016,
100, 520–525. [CrossRef]
28. Rezar, V.; Frankie, T.; Narat, M.; Levart, A.; Salobir, J. Dose-dependent effects of T-2 toxin on performance, lipid peroxidation, and genotoxicity in broiler chicken. Poult. Sci. 2007, 86, 1155–1160. [CrossRef]
29. Awad, W.A.; Vahjen, W.; Aschenbachv, J.R.; Zentek, J. A diet naturally contaminated with the Fusarium mycotoxin deoxynivalenol (DON) downregulates gene expression of glucose transporters in the intestine of broiler chickens. Livest. Sci. 2011, 140, 72–79.
[CrossRef]
30. Frankic, T.; Pajk, T.; Rezar, V.; Levart, A.; Salobir, J. The role of dietary nucleotides in reduction of DNA damage induced by T-2 toxin and deoxynivalenol in chicken leukocytes. Food Chem. Toxicol. 2006, 44, 1838–1844. [CrossRef]
31. Deepthi, B.V.; Somashekaraiah, R.; Rao, P.K.; Deepa, N.; Dharanesha, N.K.; Girish, K.S.; Sreenivasa, M.Y. Lactobacillus Plantarum
MYS6 ameliorates fumonisin B1 -induced hepatorenal damage in broilers. Front. Microbiol. 2017. [CrossRef]
32. Fodor, J.; Németh, M.; Kametler, L.; Pósa, R.; Kovács, M.; Horn, P. Novel methods of Fusarium toxins production for toxicological experiments. Acta Agrar. Kaposváriensis 2006, 10, 277–285.
33. Premier, L.; Piérard, J.Y.; Anselme, M.; Tangni, E.K.; Motte, J.C.; Larondelle, Y. Development and application of analytical methods for the determination of mycotoxins in organic and conventional wheat. Food Addict. Contam. 2006, 23, 1208–1218.
34. Trebstein, A.; Seefelder, W.; Lauber, U.; Humpf, H.-U. Determination of T-2 and HT-2 toxins in cereals including oats after immunoaffinity cleanup by liquid chromatography and fluorescence detection. J. Agric. Food Chem. 2008, 56, 4968–4975.
[CrossRef]
35. Shephard, G.S.; Sydenham, E.W.; Theil, P.G.; Gelderblom, W.C.A. Quantitative determination of fumonisins B1 and B1 by high-performance liquid chromatography with fluorescence detection. J. Liquid Chromatogr. 1990, 13, 2077–2087. [CrossRef]
36. European Commission. Recommendation of 17 August 2006 on the presence of deoxynivalenol, zearalenone, ochratoxin A, T-2 and HT-2 and fumonisins in products intended for animal feeding. Off. J. Eur. Union 2007, L 118M, 1111–1113.
37. AOAC. Official Methods of Analysis (28.054), 14th ed.; Association of Official Analytical Chemists: Arlington, VA, USA, 1984; 243p.
38. Botsoglou, N.A.; Fletouris, D.J.; Papageorgiou, G.E.; Vassilopoulos, V.N.; Mantis, A.J.; Trakatellis, A.G. Rapid, sensitive and specific thiobarbituric acid method for measuring lipid peroxidation in animal tissue, food and feedstuff samples. J. Agric. Food
Chem. 1994, 42, 1931–1937. [CrossRef]
39. Sedlak, J.; Lindsay, R.H. Estimation of total, protein-bound and non-protein sulfhydryl groups in tissues with Ellmann’s reagent.
Anal. Biochem. 1968, 25, 192–205. [CrossRef]
40. Lawrence, R.A.; Burk, R.F. Glutathione peroxidase activity in selenium-deficient rat liver. Biochem. Biophys. Res. Commun. 1976,
71, 952–956. [CrossRef]
41. Lowry, O.H.; Rosebrough, N.J.; Farr, A.L.; Randall, R.J. Protein measurement with the Folin phenol reagent. J. Biol. Chem. 1951,
193, 265–275. [CrossRef]
42. Yang, L.; Yu, Z.; Hou, J.; Deng, Y.; Zhou, Z.; Zhao, Z.; Cui, J. Toxicity and oxidative stress induced by T-2 toxin and HT-2 toxin in broilers and broiler hepatocytes. Food Chem. Toxicol. 2016, 87, 128–137. [CrossRef]
43. Balogh, K.; Kövesi, B.; Zándoki, E.; Kulcsár, S.Z.; Ancsin, Z.S.; Erdélyi, M.; Dobolyi, C.S.; Bata-Vidács, I.; Inotai, K.; Szekeres,
A.; et al. Effect of sterigmatocystin or aflatoxin-contaminated feed on lipid peroxidation and glutathione redox system and expression of glutathione redox system regulatory genes in broiler chicken. Antioxidants 2019, 8, 201. [CrossRef]
44. Livak, K.J.; Schmittgen, T.D. Analysis of relative gene expression data using real-time quantitative PCR and the 2(-Delta Delta
C(T)) method. Methods 2001, 25, 402–408. [CrossRef]
45. Szabó, A.; Szabó-Fodor, J.; Fébel, H.; Mézes, M.; Bajzik, G.; Kovács, M. Oral administration of fumonisin B1 and T-2 individually and in combination affects hepatic total and mitochondrial membrane lipid profile of rabbits. Acta Physiol. Hung. 2016, 103,
321–333. [CrossRef]
46. Holman, R.T. Autoxidation of fats and related substances. In Progress in Chemistry of Fats and Other Lipids; Holman, R.T., Lundberg,
W.O., Malkin, T., Eds.; Pergamon Press: London, UK, 1954; Volume 2, pp. 51–98.
47. Stockmann-Juvala, H.; Mikkola, J.; Naarala, J.; Loikkanen, J.; Elovaara, E.; Savolainen, K. Oxidative stress induced by fumonisin
B1 in continuous human and rodent neural cell cultures. Free Radic. Res. 2004, 38, 933–942. [CrossRef]

Related topics
Authors:
Benjamin Kövesi
Krisztián Balogh
Szent István University
Erika Zándoki
Szent István University
Ancsin Zsolt
Szent István University
Mézes Miklós
Szent István University
Show more
Recommend
Comment
Share
Profile picture
Would you like to discuss another topic? Create a new post to engage with experts in the community.
Join Engormix and be part of the largest agribusiness social network in the world.