Introduction
Aflatoxins are secondary metabolites from certain fungal lineages of the Aspergillus genus, mainly A. flavus and A. parasiticus. Aflatoxins B1, B2, G1, and G2 are natural contaminants of seeds and feed, mainly nuts, peanuts, cotton seeds, maize, and other oilseeds (Sweeney and Dobson, 1998; Stroka et al., 2000).
Obtaining trustable results on mycotoxins analysis in feed is important for management and mycotoxicological control purposes (Krska et al., 2005). However, the heterogeneous distribution of mycotoxins in cereals leads to variations on the final results, so called errors, not being possible to establish the real mycotoxins concentration in a determined lot (Whitaker 2004; Miraglia et al., 2005; Vargas et al., 2006). Thus, the efficiency of a sampling plan can be estimated by the evaluation of the variance of the results generated by the quantification procedures applied. The probabilities of acceptance or rejection of a lot with certain mycotoxin concentration depend on the performance of the sampling plan applied (Johansson et al., 2000a; Johansson et al., 2000c; Miraglia et al., 2008), i.e. the better the performance of the sampling plan, safer the acceptance or rejection probabilities of this lot. To achieve that, it is necessary to establish the procedures for the sampling plan, as well as a limit for acceptance/rejection. The quantification procedures can be divided into three stages: 1- Sampling: taking a sample from a lot; 2- Sample preparation: milling the sample to reduce the size of its particles and take a subsample for analysis, and; 3- Analysis: extract the mycotoxin from the subsample and quantify it (Whitaker et al., 2011).
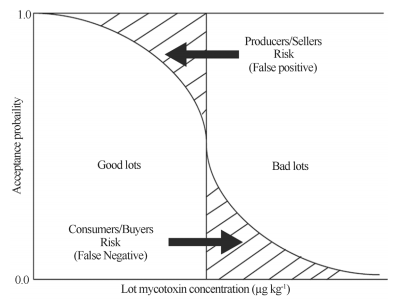
The variance on the quantification results can lead to two kinds of errors: the false positive or producer/seller risk, in which a good lot is labeled as bad, and the false negative or consumer/buyer risk, where a bad lot is labeled as good. The frequency of occurrence of those two kinds of errors depends on the sampling plan and is given by the design of a characteristic operation curve (OC) (Johansson et al., 2000c; Miraglia et al., 2005; Vargas et al., 2006).
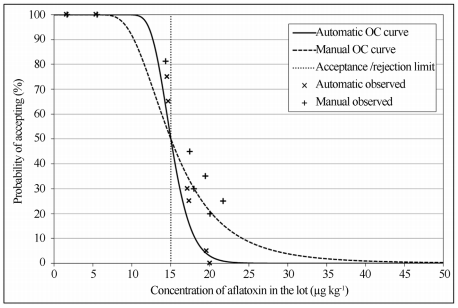
In regards to mycotoxins, an OC curve relates the toxin concentration in the lot (x-axis) with the probability to accept this lot (y-axis). Using a pre-established acceptance/rejection limit, the OC curve shows each seller/producer and buyer/consumer risk (as shown in Figure 1) (Miraglia et al., 2008). For each sampling plan, the risks are defined by the sampling method, sample size, subsample preparation and size, number of analysis, and analyses method (Whitaker et al., 2011).
Due to the lack of information on the identification of the efficiency of different sampling plans, the aim of this research was to evaluate the performance of two different sample collection methods for aflatoxins quantification in maize.
Material and Methods
Sample collection
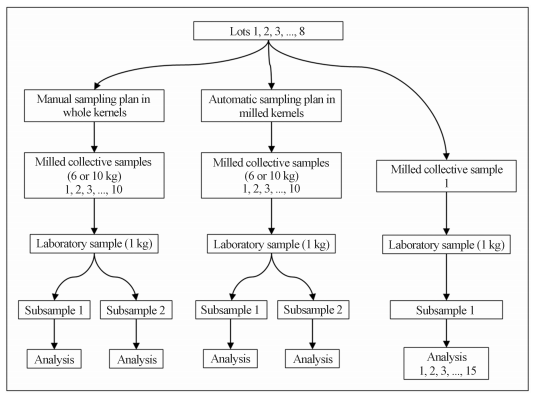
Maize sample collection was performed in eight trucks with a load ranging from 13 to 32 tons of maize. On each truck (lot) two sampling plans for aflatoxins (B1+B2+G1+G2) quantification were applied: manual and automatic. The experimental design used to determine the variance associated to each stage of the aflatoxins quantification procedure on both sampling plans is presented on Figure 2.
For the manual sampling plan, kernel samples were taken using a sampling spear with 10 collector chambers. The size of each kernel sample followed the EC Regulation No. 401/2006 (European Commission Regulation-EC No 401, 2006). From three lots with sizes ranging from 13 to 20 tons, a 6 kg collective sample was obtained from each lot through 60 increments taken from six different sampling spots. From five lots with sizes greater than 20 tons, a 10 kg collective sample was obtained from each lot trough 100 increments taken from ten different sampling spots. This procedure was performed 10 times to each maize lot.
For the automatic sampling plan, the same eight lots of maize were milled (particles smaller than 9 mesh) in hammer mills and moved along the factory through a screw conveyor. Outside this screw conveyor 10 continuous flow sampling systems were installed using 10 holes with 17.5 mm diameter located on the right-hand side (along the milled maize flow), 45° from the base of the tube. The size of the collective samples for each lot was calculated based on the equation 1, and ranged from 16.1 to 25.3 kg.
where Cs is the collective sample in kg and m is the size of the lot in tons.
After the collection procedure, all the 20 samples from each lot were milled in a hammer mill with a 2 mm strainer. The milled samples were reduced to the size of 1 kg (laboratory sample) using a sample splitter with inverted channels, packed in plastic bags, and stored at -18 °C.
Sample preparation
Each laboratory sample was milled in a Retsch® ZM 200 ultra centrifugal mill (Altmann, São Paulo, SP, Brazil), at 17,000 rpm, with a 1.5 mm strainer, and split into 10 subsamples using a Retsch® PT 100 sample divider (Altmann, São Paulo, SP, Brazil).
Figure 1 - Operation characteristic (OC) curve to estimate the lot acceptance/rejection probabilities and evaluate producer/seller and consumer/buyer risks, according to Miraglia et al. (9).
Figure 2 - Experimental design applied to evaluate two sampling plans for aflatoxins analysis in 8 lots of maize.
Aflatoxin analysis
Analysis of aflatoxins (B1+B2+G1+G2) was performed once in two out of ten subsamples from each laboratory sample and 15 times in one extract from one subsample from each lot, totalizing 1,400 analyses. The chromatographic method was applied according to Sulyok et al. (2007) and showed quantification limit a recovery coefficient for aflatoxins as follows: 1 μg kg-1 and 94.5% for B1; 1 μg kg-1 and 80.0% for B2; 1 μg kg-1 and 88.5% for G1 and; 1 μg kg-1 and 88.1% for G2.
Variability of the results on aflatoxins quantification
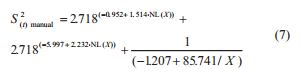
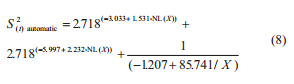
The variability of the results on aflatoxins quantification was determined by the calculation of the variance. The total variance (S2(t)) associated to the procedure of aflatoxins quantification is composed by the sum of sample variance (S2(s)), preparation variance (S2(p)), and analysis variance (S2(a)) (Cheli et al., 2009; Ozay et al., 2006; Whitaker et al., 2011), according the Eq. (2).
The results for S2(s), S2(p), and S2(a) were obtained by replicating results from lot, laboratory sample, and extract, respectively.
Theoretical distributions of the results from aflatoxins concentration
Four theoretical distribution models (all 2-parameter) were tested to simulate the distribution of the results from aflatoxins quantification on each lot of maize: normal, lognormal, gamma, and Weibull. Each theoretical distribution was observed from the results of 20 subsamples per lot and per sampling plan, totalizing 64 distributions.
Observed distributions of the results from aflatoxins concentration
The observed distributions were determined from the 20 results of aflatoxins quantification from each lot at each sampling plan, totalizing 16 observed distributions. The observed acceptance probabilities were calculated for each lot by counting the number of results less than or equal the acceptance limit used (15 μg kg-1) and divided by 20 (number of analyses per lot in each sampling plan). A total of 8 observed points were determined to each sampling plan (one per lot). The higher value attributed to the acceptance probability was 1.0 (20/20) or 100% and the next was 0.95 (19/20).
Selection of the theoretical distribution model
The Chi-square test was used as criteria to evaluate the goodness of fit among the theoretical and observed distributions from aflatoxins concentrations. The adjustment between the theoretical distribution and the observed one was considered to be acceptable when the statistic test did not exceed the critical value 95% (p ≥ 0.05).
Statistical analysis
The components of the total variance were estimated for the eight lots at both sampling plans using ANOVA. The individual variances from each stage (sampling, preparation, and analysis) were submitted to a multi-factor ANOVA, using the average aflatoxins concentration (B1+B2+G1+G2) as covariate on the variance from each stage. Variances from each stage were compared between sampling plan using the F test at 95% of significance (p ≤ 0.05). The sampling variances for each sampling plan, as well as the variances of preparation and analysis (regardless the sampling plan) were submitted to regression analysis against aflatoxins concentration (B1+B2+G1+G2) to obtain the equations. Models that showed the less value of p were used.
The estimated acceptance probabilities associated with the sampling plans described above were calculated using the lognormal distribution. Parameters for the lognormal distribution were determined using the average aflatoxin concentration (X) and the variances S2(t) manual and S2(t) automatic. The acceptance/rejection limit used was 15 μg kg-1.
Variance estimates, regression analyses, and evaluation of the theoretical distributions were performed using the statistical program Statgraphics Plus 5.0. The acceptance/rejection probabilities calculation and the OC curves development were performed using Microsoft Excel 2010.
Results and Discussion
Variability
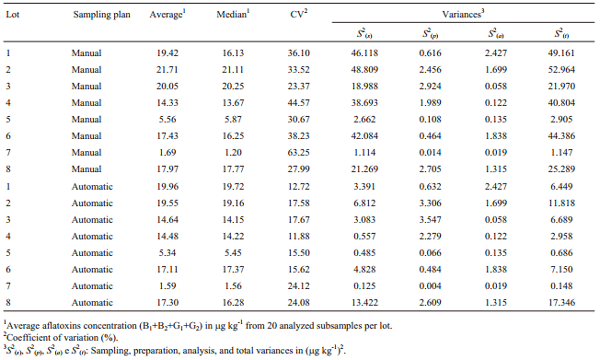
Table 1 shows the variance of aflatoxins concentrations from the stages of sampling, preparation, analysis, and the total variance. Total aflatoxin concentration results from 320 subsamples analyzed ranged from 1.0 to 37.1 μg kg-1.
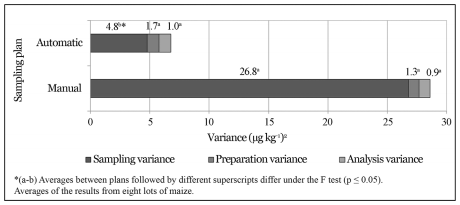
Variance associated with the sampling procedure and the total variance were respectively 5.6 and 3.9 times lower at the automatic sampling plan than at the manual one (p ≤ 0.05). As the procedures for the preparation and analysis stages were the same, there were no differences between their variances (p = 0.57 and p = 0.80) (Figure 3).
Johansson et al. (2000a) estimated the total variance components of the results from aflatoxins quantification in lots of maize. Thus, they toke a 45 kg collective samples from each lot, reduced them to 1.13 kg and milled them. They evaluated lots of maize with similar aflatoxins concentration found in this research. However, the variance associated with each stage of the aflatoxins quantification procedure was lower in this study. Regarding the sampling stage, the lower variability found in this research is probably due to the fact that collective samples were milled before the laboratory sample was taken. Milling the collective sample raises the number of particles per unit of mass, lowering the variability among the analysis results (FAO 1993). Preparation and analysis stages also showed lower variability, because samples were prepared using different equipments and methods for milling and sub sampling. The analysis performed with high performance liquid chromatography tandem mass spectrometry (LC-MS/MS) is more specific and has simpler extraction and analyses procedures (Sforza et al., 2006), than those applied to the thin layer chromatography (TLC) used by Johansson et al. (2000a).
Table 1 - Average and median of aflatoxins concentration, coefficient of variation and sampling, preparation, analysis, and total variances by lot of maize and sampling plan.
Figure 3 - Average of the variances from each stage of the aflatoxins quantification procedure in maize (sampling, preparation, and analysis) from the manual and automatic sampling plan.
Shotwell et al. (1975) found that if a lot is properly mixed, contaminated particles will probably be equally distributed along its mass. Under this condition, the spot where the sample is taken is probably not relevant. However, if the lot is not previously mixed, mycotoxin contaminated particles can be located in some delimited areas of the lot. Thus, if sampling is done by taking samples from only one spot on the lot, contaminated particles may not be sampled, or, many contaminated particles may be harvested (Whitaker et al., 2011). Those situations can occur more frequently when using the manual sampling system approached in this research.
A sample is much more significant if it is harvested from milled materials due to the highest number of particles per unit of volume or per unit of mass when compared to whole kernels (Tittlemier et al., 2011). In several studies, Whitaker et al. (1976, 1994, 1998, 2011) found that the sample size infers on the variability of the results, in other words, as bigger the sample, the smaller the variance. The collection of increments while a lot is being moved from one side to other (dynamic lot) provides better representativity to the sample when compared to the sampling applied to a static lot (Miraglia et al., 2005; Whitaker et al., 2011). In this research, the reduction on the results variability from aflatoxins concentration at the automatic sampling is probably associated to the fact that the whole lot is milled and conducted through a screw conveyor thus, both the milling process and the transportation help on the lot homogeneity. Besides, the collective sample size at the automatic sampling plan is bigger and the collection of increments is uninterrupted, which means there is always a small portion being harvested giving a better randomness on particles collection and thus, better representativity of the sample.
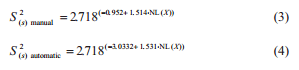
The S2(s) estimate was performed using the regression analysis for each sampling plan, where the equation between sampling variance and aflatoxins concentration (X) was:
under a determination coefficient (R2 ) of 0.887 and 0.730 respectively, and where NL is the natural logarithm.
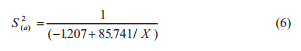
The S2(p) and the S2(a) were obtained by performing only one regression analysis using both sampling plans, where the equation between preparation variance and aflatoxins concentration (X) was:
and the equation between analysis variance and aflatoxins concentration (X) was:
under R2 = 0.849 and 0.875 respectively. The S2(t) was estimated by the sum of S2(s), S2(p), and S2(a):
The variance estimate in each stage from both sampling plans rose as the aflatoxins concentration rose (r > 0.85). Similar results were observed by Johansson et al. (2000a) in a research with aflatoxins in maize, Whitaker et al. (1994) with aflatoxins in peanuts, and Whitaker et al. (1998) with fumonisins in maize.
The S2(t) estimate associated to a lot of maize with 15 μg kg-1 of aflatoxins is 24.57 (μg kg-1) 2 at the manual sampling plan and 4.31 (μg kg-1) 2 at the automatic one. The S2(s) manual, S2(s) automatic, S2(p), and S2(a) are 23.30, 3.04, 1.05, and 0.22 (μg kg-1) 2 respectively. The S2(s), S2(p), and S2(a) represent about 95%, 4%, and 1% of the total variance from the manual sampling plan and 71%, 24%, and 5% of the total variance from the automatic sampling plan. The percentage of S2(t) that corresponds to preparation and analysis was bigger at the automatic sampling plan due to a reduced S2(s) in this sampling plan. At both sampling plans, the S2(s) had the major contribution to the S2(t), followed by the S2(p) and S2(a). This is consistent with observations on other mycotoxins in several seeds and feeds (Whitaker et al., 1976, 1998; FAO 1993; Johansson et al., 2000c; Ozay et al., 2006).
Distribution of aflatoxins results
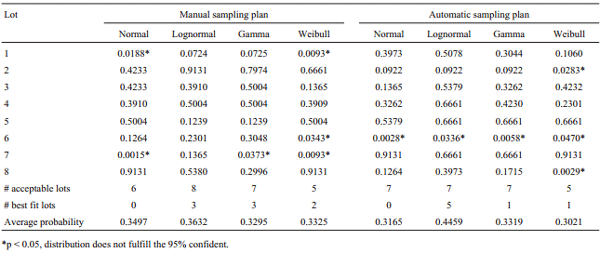
A summary of the Chi-square test for each theoretical distribution is described at the end of Table 2. Despite the fact that similar models have been used to precisely simulate the distribution of the results from mycotoxins quantification in seeds and feeds (Sharkey et al., 1994; Giesbrecht et al., 1998; Johansson et al., 2000b; Vargas et al., 2006), lognormal distribution was chosen because it obtained the major number of lots with acceptable distribution and highest average probability. Thus, this distribution was used to calculate the OC curve and evaluate the performance of both sampling plans for aflatoxins quantification in maize.
Operation characteristic curve
The OC curves of both sampling plans are illustrated on Figure 4 with their observed and estimated acceptance probabilities. The difference on shape from both OC curves is only due to the sampling stage, as the other stages were the same for both sampling plans. Comparing both OC curves, it is possible to verify that the automatic sampling plan reduces both producer/seller and consumer/buyer risks (indicated on Figure 1). As an example: a lot of maize with a theoretical aflatoxins contamination of 20 μg kg-1 and a limit of acceptance/rejection of 15 μg kg-1. If this lot were sampled using the manual sampling plan described in this research, it would have a 21% chance of being accepted under the limit established. On the other hand, if the same lot were sampled using the automatic sampling plan described in this research, it would have only a 3% chance of being accepted under the limit established.
Conclusions
The total variance associated to the procedures for aflatoxins quantification in maize at both the manual and automatic sampling plan raises as the aflatoxins concentration raises. The sampling stage contributes with the highest variability, followed by the preparation and analysis stages. Sampling variance and total variance are reduced at the automatic sampling plan, because it is applied in milled grains in movement, in a continuous way, and with a bigger collective sample, proving have a better performance against 40 M the manual sampling plan. The OC curve from the automatic sampling plan reduces both producer/seller and consumer/buyer risks when compared to the OC curve from the manual sampling plan, thus, reducing the chances of misclassification of maize lots and providing more safety in commercial trades.
Table 2 - Chi-square test probabilities on normal, lognormal, gamma, and Weibull distributions of the results from aflatoxins quantification in eight lots of maize at the two sampling plans evaluated.
Figure 4 - Operational characteristic (OC) curves from manual and automatic sampling plans for aflatoxins quantification in maize, with observed acceptance probabilities and an acceptance/rejection limit of 15 g kg-1.
Acknowledgments
To Laguiru Cooperative for providing the facilities for maize sample collections; to CAPES and CNPq for the scholarship; and to FAPERGS for financial support.
This article was originally published in Brazilian Journal of Microbiology 45, 1, 35-42 (2014). Copyright © 2014, Sociedade Brasileira de Microbiologia ISSN 1678-4405. This is an Open Access article licensed under a Creative Commons License CC BY-NC. References
Cheli F, Campagnoli A, Pinotti L, Fusi E, Dell’orto V (2009) Sampling feed for mycotoxins: acquiring knowledge from food. Ital J Food Sci 8:5-22.
European Commission Regulation (2006) No 401/2006 of 23 February 2006 laying down the methods of sampling and analysis for the official control of the levels of mycotoxins in foodstuffs. Official Journal of European Union L70:12-34.
FAO - Food and Agriculture Organization (1993) Sampling plans for aflatoxin analysis in peanuts and corn. FAO Food and Nutrition. Paper 55, FAO, Viale Della Terme di Caracalla 00100, Rome, Italy, p. 27-56.
Giesbrecht FG, Whitaker TB (1998) Investigations of the problems of assessing aflatoxin levels in peanuts. Biometrics 54:739-753.
Johansson AS, Whitaker TB, Hagler WM,Giesbrecht FG, Young JH, Bowman DT (2000) Testing shelled corn for aflatoxin, part I: estimation of variance components. J AOAC Int 83:1264-1269.
Johansson AS, Whitaker TB, Giesbrecht FG, Hagler WM, Young JH (2000) Testing shelled corn for aflatoxin, part II: modeling the distribution of aflatoxin test results. J AOAC Int 83:1270-1278.
Johansson AS, Whitaker TB, Giesbrecht FG, Hagler WM, Young JH (2000) Testing shelled corn for aflatoxin, part III: evaluating the performance of aflatoxin sampling plans. J AOAC Int 83:1279-1284.
Krska R, Welzig E, Berthiller F, Molinelli A, Mizaikoff B (2005) Advances in the analysis of mycotoxins and its quality assurance. Food Addit Contam 22:345-353.
Miraglia M, De Santis B, Minardi V, Debegnach F, Brera C (2005) The role of sampling in mycotoxin contamination: an holistic view. Food Addit Contam: part A 22:31-36.
Miraglia M, De Santis B, Pannunzi E, Debegnach F, Brera C (2008) Mycotoxin concentration data quality: the role of sampling. In: Leslie, F.J.; Bandyopadhyay, R.; Visconti, A. (eds). Mycotoxins: detection methods, management, public health and agricultural trade. Wallingford, UK, Cabi, p. 101-168.
Ozay G, Seyhan F, Yilmaz A, Whitaker TB, Slate AB, Giesbrecht F (2006) Sampling hazelnuts for aflatoxin: uncertainty associated with sampling, sample preparation, and analysis. J AOAC Int 89:1004-1011.
Sforza S, Dall’asta C, Marchelli R (2006) Recent advances in mycotoxin determination in food and feed by hyphenated chromatographic techniques/mass spectrometry. Mass Spectrom Rev 25:54-76.
Sharkey AJ, Roch OG, Coker RD (1994) A case-study on the development of a sampling and testing protocol for aflatoxin levels in edible nuts and oil-seeds. J R Soc Series D (The Statistician) 43:267-75.
Shotwell OL, Goulden ML, Bothast RJ, Hesseltine CW (1975) Mycotoxins in hot spots in grains. 1. Aflatoxin and zearalenone occurrence in stored corn. Cereal Chem 52:687-697.
Stroka J, Anklam E, Jörissen U, Gilbert J (2000) Immunoaffinity column clean-up with liquid chromatography using postcolumn bromination for determination of aflatoxins in peanut butter, pistachio paste, fig paste, and paprika powder: collaborative study. J AOAC Int 83:320-340.
Sulyok M, Krska R, Schuhmacher R (2007) A liquid chromatography/tandem mass spectrometric multi-mycotoxin method for the quantification of 87 analytes and its application to semi-quantitative screening of moldy food samples. Anal Bioanal Chem 389:1505-1523.
Sweeney MJ, Dobson ADW (1998) Mycotoxin production by Aspergillus, Fusarium and Penicillium species. Int J Food Microbiol 43:141-158.
Tittlemier SA, Varga E, Scott PM, Krska R (2011) Sampling of cereals and cereal-based foods for the determination of ochratoxin A: an overview. Food Addit Contam: part A 28:775-778.
Vargas EA, Whitaker TB, Dos Santos EA, Slate AB, Lima FB, Franca RCA (2006) Design of a sampling plan to detect ochratoxin A in green coffee. Food Addit Contam.: part A 23:62-72.
Whitaker TB, Whitten ME, Monroe RJ (1976) Variability associated with testing cottonseed for aflatoxin. J Am Oil Chem Soc 53:502-505.
Whitaker TB, Dowell FE, Hagler WM, Giesbrecht FG, Wu J (1994) Variability associated with sampling, sample preparation, and chemically testing for aflatoxin in farmers’ stock peanuts. J AOAC Int 77:107-116.
Whitaker TB, Trucksess MW, Johansson AS, Giesbrecht FG, Hangler WM, Bowman DT (1998) Variability associated with testing corn for fumonisin. J AOAC Int 81:1162-1168.
Whitaker TB, Sampling for mycotoxins (2004) In: Magan, N.; Olsen, M. (eds). Mycotoxins in food: detection and control. Cambridge, UK, Woodhead Publishing Ltd., p.69-87.
Whitaker TB, Slate A, Doko B, Maestroni B, Cannavan A (2011) Sampling procedures to detect mycotoxins in agricultural commodities. Springer, New York, USA.