As this is written (Winter, 2012) feed prices continue to hover around historic highs and although milk prices have risen they have not kept pace with the increases in feed costs. Feed costs are usually the largest single expense on a dairy farm and with well-above average feed costs, the feeding management and nutrition of the dairy herd must be scrutinized now more than ever.
Expressing Feed Costs
Various terms can be calculated to describe feed costs:
- $/dry cow/day or $/all dry cows/day
- $/replacement/day or $/all replacements/day
- $/lactating cow/day (with or without including feed costs for heifers and dry cows)
- $/lb of milk (with or without feed costs for replacements and dry cows)
- Income over feed costs (with or without feed costs for heifers and dry cows)
- Feed costs for replacements and dry cows are usually calculated as $/day for each animal. This is useful to determine whether the nutrition and ration balancing for these animals are appropriate but a reasonable $/dry cow/day or $/heifer/day cost does not necessarily mean that feed costs for dry cows or feed costs for replacements are acceptable. You must examine the total feed bill for dry cows and the total bill for replacements. If your average $/dry cow/day is reasonable but the average days dry is 90, you are spending too much feeding dry cows. The same is true if you are calving heifers at 27 months. Look at both cost per individual animal (dry and heifer) and cost for the entire group.
- Lactating cows have to cover all the bills so it makes sense to include feed costs associated with heifers and dry cows when calculating feed costs for lactating cows; however, combining all feed costs into a single value does not allow you to determine whether specific costs are reasonable. You need to calculate the daily feed costs for lactating cows, dry cows and replacements. These groups can be divided further; for example, early lactation cows and late lactation cows, young heifers and bred heifers, etc. Calculating feed costs for more specific groups can be useful in identifying what specific areas should be targeted for cost control but it also requires substantially more time and effort to do so. The problem with feed costs expressed on a daily per cow basis is that it ignores milk production. A high producing herd is expected to have higher feed costs on a cow basis than a lower producing herd.
- Feed costs per unit of milk (e.g., $/100 lbs. of milk) accounts for differences in milk production. Including feed costs for dry cows and replacement (i.e., total feed costs/100 lbs. of milk) allows you to compare your farm to others but does not allow you to determine what areas of nutrition are cost-effective and which areas need work. The problem with expressing feed costs as $ for lactating cows/100 lbs. of milk is that it ignores milk composition. Milk with a higher fat and protein concentration is worth more and may cost more to produce than milk with lower fat and protein.
- Income over feed costs (IOFC) solves the problem of varying milk composition, however IOFC is very sensitive to milk price. Feed costs can be excessive on a farm but with a high milk price, the IOFC might look fine. On the other hand, a farm might have excellent feed cost control but the price of milk is low making IOFC look bad.
No single expression of feed costs is appropriate for all situations. When evaluating a diet change make sure you evaluate the correct measure of feed costs. If an additive is supposed to increase milk protein, do not evaluate that feed additive by comparing $/100 lbs. of milk, use IOFC. On the other hand, if you are comparing last month’s diet to this month and milk prices changed, $/100 lbs. of milk would be better than IOFC.
Feed Cost Control
Numerous factors affect feed costs and numerous approaches can be used to control them. Feed cost factors can be divided into the following broad classes:
- Herd Structure
- Ingredient selection
- Ration formulation specifications
- Feed wastage and shrink
- Marketing/purchasing
Marketing deals with contracting, futures, timing purchases, comparing suppliers, etc. These topics are beyond the scope of this paper (and my knowledge) and will not be discussed further.
Herd Structure
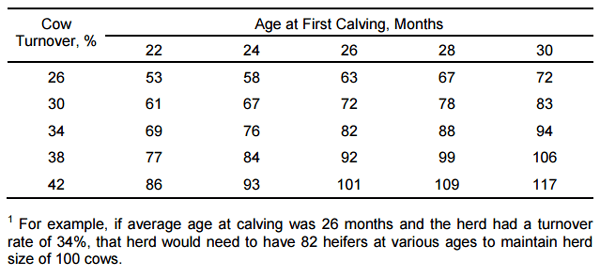
How can a farmer reduce feed costs by 30 to 50 cents/100 lbs. of milk for a 100 cow herd averaging 70 lbs. of milk? Calve heifers at 24 months rather than 27 months. Herd structure, especially the number of replacements and dry cows has a substantial affect on feed costs. Reducing the number of heifers on the farm by calving at the correct age and keeping culling rate reasonable reduces the number of ‘nonproductive’ animals you have to feed (Table 1). Numerous resources our available on the proper feeding and management of heifers and will not be discussed here. Proper facilities, good nutrition and genetics and general good cow management will all help keep culling at an acceptable rate. A little more attention to heifer management may have a much bigger effect on feed costs than the next ‘new and improved’ feed additive.
Ingredient Selection
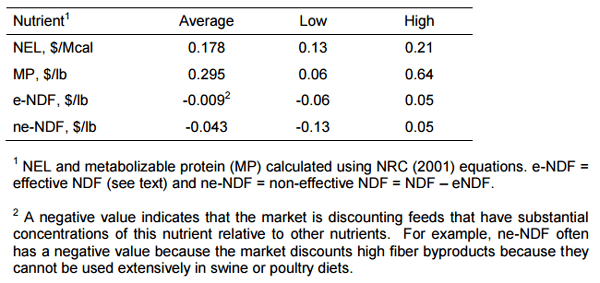
Often this is what most people start thinking about when controlling feed costs are discussed. The question that is often asked is “What can I feed that is cheap?” but the more correct question is, “what combination of ingredients will result in a lower cost diet (without adversely affecting milk yield)?” Ingredient selection can have a substantial impact on feed costs and ingredient prices should be monitored on a regular schedule. This does not mean diets should be changing constantly to chase the lowest ingredient prices. But long term trends should be examined to determine if different ingredients should be included in diets. Various computer programs are available that can compare economic value of different feeds but it is beyond the scope of this paper to discuss such programs. For this paper, we used a program called SESAME which calculates the cost of various nutrients for a given feed market using a least squares regression approach. This program calculates the average price of nutrients from a market basket of ingredients (Table 2). The concentration of NEL, metabolizable protein (MP), effective NDF, and non-effective NDF accounts for about 98% of the variation in feed costs and were used to estimate the economic value of feeds. For this paper, NEL and MP were calculated using NRC equations and effective NDF was set at 0.92, 0.98, 0.75, 0.82, 0.25, and 1.00 times NDF for alfalfa hay, grass hay, corn silage, haycrop silage, most byproducts, and whole cottonseed.
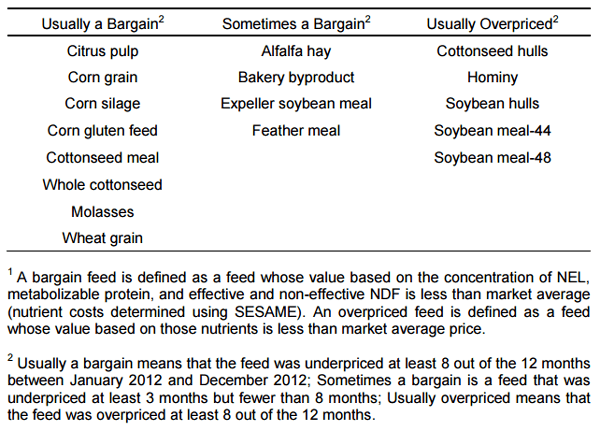
Ingredient costs based on northern Florida feed markets were followed for a 12 month period (January 2012-December 2012). Actual market price was compared to the value of their nutrients as calculated by SESAME. As expected, the average feed was priced at about its break-even point; however, we do not have to feed the ‘average feed’. Several feeds provided more nutrients per dollar than the general market the majority of the time (i.e., good buys most of the time). Conversely, several ingredients were consistently overpriced (i.e., provided fewer nutrients per dollar than the market average). Although past performance is no guarantee of future performance (this sounds like a disclaimer on a mutual fund), feeds in the ‘Usually a Bargain’ list should be considered whereas feeds in the ’Rarely a Bargain’ list need to be evaluated carefully (Table 3). Remember, a bargain is only a bargain if you need the nutrients provided by the feed. If you do not need MP, buying cottonseed meal, even though it is a bargain, will inflate feed costs.
The value, not the price, of an ingredient depends on its nutrient content but also on other difficult to quantify characteristics such as consistency, supplier support, and ‘quality of the product’. An ingredient may be extremely cheap (or even free) but if it is spoiled and has pockets of mold throughout the load, it probably is worth less than free. A product that is highly variable in nutrient composition is worth less than one that is consistent but at this time we cannot put a dollar value on that. A supplier that can answer questions, provide technical support and goes the extra mile to ensure your satisfaction provides definite value but we cannot put a dollar value on it. The information in Table 3 does not consider any of the above factors but you need to include those in your decision making.
Ration Formulation Specifications
We have reasonably accurate estimates for the requirements of many nutrients; however, in practice, diets are usually over formulated (i.e., a safety factor is used so that a diet exceeds the nutrient requirements of the average cow). A safety factor can be defined as the degree to which a nutrient is overfed to reduce the likelihood that the nutrient will be deficient or will limit milk production. For example, a cow may require 100 grams of calcium for her level of milk production but the diet is formulated to provide 120 g (a safety factor of 20%). For most nutrients, safety factors are absolutely essential to obtain maximal herd productivity. The question is not, whether diets should be over formulated but rather, how much should we over formulate? The answer to that question is not a constant. It depends on milk price, feed costs, ingredients used, pen grouping system, farm/feed management, and also varies among different nutrients.
Some general relationships regarding safety factors include:
As milk price increases and/or feed costs decline = Greater over formulation
As milk price decreases and/or feed costs increase = Less over formulation
Use of variable ingredients = Greater over formulation
Use of consistent ingredients = Less over formulation
Homogenous (parity, stage of lactation) pens = Less over formulation
Heterogeneous pens = Greater over formulation
Good feeding management (recipe is followed, ingredients are sampled frequently, proper mixing, standard operating procedures are used, etc.) = Less over formulation
Poor feeding management = Less or greater over formulation
Poor facilities/poor general management = Less over formulation
Milk/feed prices. The relationship between the magnitude of the safety factors and milk and feed price is basically risk vs. reward. Over formulation of diets definitely increases feed costs. The higher the price of the ingredients, the higher the cost of over formulation. The reward of over formulation is potentially increased milk yields which may or may not occur. When milk is expensive and feed is cheap, the potential reward of more milk is usually worth the risk of higher feed costs. But when the opposite is true, a larger reward (i.e., greater marginal response in milk yield) is needed to cover the cost of over formulation.
Ingredient variation. The more variable the ingredients, the less confidence you have that the nutrient composition of the diet that is fed actually matches the formulated diet. On average, half the time, the diet will exceed your formulation goals and half the time it will be below your goals. In theory, when a major nutrient is deficient milk production will decrease but when the nutrient is adequate, feeding more will not increase milk production. Therefore the 50% of the time the diet contains more nutrient than expected, we do not expect a milk response but the 50% of the time the nutrient is deficient we expect milk yield to drop. The greater the variation (i.e., the less consistent the ingredients) the greater the potential drop in milk production.
Animal Homogeneity within Pens. A reason commonly given for over formulation is that if you feed for the average cow in the pen, cows producing above average will not get enough nutrients and milk yield will drop. This often will not occur because cows that produce more milk usually eat more feed resulting in greater intake of nutrients. However, this is not true for early lactation cows; they can produce above pen average milk yields and have below pen average dry matter intake. The same is true for first lactation cows compared with more mature cows. Therefore, the variation in days in milk (DIM), and to a lesser extent parity, within a pen is usually more important than variation in milk yields. Pens that contain a diverse population of cows (based on DIM and parity) must be fed diets that substantially exceed the nutrient requirements of the average cow in the pen.
Feeding management. Good feeding management increases the confidence that the ration delivered to the cows is the ration that was formulated and therefore, diets can be formulated to more closely match actual requirements. On the other hand, poor feeding management or general poor management may or may not dictate increased over formulation. With poor management, you are less confident that the formulated diet is the diet delivered to the cows which could indicate the need for greater over formulation. On the other hand, poor management means that factors other than nutrient composition may be limiting production and over formulation will simply increase costs and not affect milk yield. Another factor that needs to be considered is cow health. Over formulating diets with respect to energy usually, increases the risk of acidosis. Farms with poor management can be at high risk for acidosis and feeding a diet with excess energy may lead to substantial problems.
Nutrients. The potential costs of overfeeding a specific nutrient (e.g., inflated feed costs, health problems, toxicity, etc.) must be balanced with the potential costs of underfeeding specific nutrients (decreased milk yields, lower reproductive efficiency, health problems) when determining safety factors.
Vitamins and minerals. Mild underfeeding of these nutrients will likely not affect milk yields but could increase health problems such as mastitis and retained fetal membranes and might reduce reproductive efficiency. For Ca, K, Na, Cl, Zn, and Fe requirements are reasonable well-established (NRC, 2001) and few real-world antagonists exist; therefore only a small safety factor (perhaps NRC plus 10 to 20%) is needed. For P, most available data show that the current NRC requirement is more than adequate so essentially no safety factor is required. Because of the cost of byproducts (which are often high in P), diets with excess P may actually be cheaper than diets that meet P requirement. However, this assumes no increased cost for manure management. Feeding excess P will increase the concentration of P in manure and this may increase manure hauling costs and other costs necessary to meet environmental regulations. A larger safety factor (NRC times 1.5 to 1.75) should be applied to Mg because high concentrations of dietary K (which frequently occur) reduce Mg absorption substantially. Absorption of Cu can be lower than expected because of antagonists such as sulfur and molybdenum. Excess sulfur is not uncommon because water can often contain high concentrations of sulfur and diets often have high inclusion rates for distillers grains (can be very high in sulfur). If antagonists are present Cu concentrations may have to be doubled and you should consider using highly available sources. If antagonists are not a problem a safety factor of about 20% is adequate. Based on recent studies (Hansen et al., 2006; Weiss and Socha, 2005), the NRC requirement for Mn is too low and diets should contain approximately 2 times current NRC. The preponderance of available data show that feeding more than the current NRC recommendation for vitamins A and E to dry and lactating cows has no benefit (there are data showing positive effect of increased vitamin E during the transition period). In most cases, the safety factor for vitamins A, D, and E should be small (perhaps 10%). Many diets are over supplemented with minerals and vitamins and this will increase diet costs. In most situations, diets should be formulated to slightly exceed NRC recommendations for minerals and vitamins. This will help control costs and almost always meet the needs of the cows.
Energy and Protein. Rumen degradable protein (RDP) is inexpensive but if it is deficient milk yields could be reduced substantially. The NRC (2001) may overestimate RDP requirement (Colmenero and Broderick, 2006) but because of low cost and potential positive milk or milk protein response (Reynal and Broderick, 2005) dietary RDP should exceed the current NRC. The optimal safety factor for RDP has not been determined but it probably is around 105 to 110% of NRC). Most feeds contain both RDP and rumen undegradable protein (RUP), therefore increasing RDP can also increase RUP and RUP is expensive. This is one reason why RDP should not be grossly overfed. Increasing RDP also increases MUN and this has been related to lower reproductive efficiency. Because the RDP requirement is a function of rumen fermentation and not milk production, the same safety factor can be applied to all lactating cows.
The optimum RUP is dependent on milk price, feed price, and the population of cows in a pen. If a pen includes cows of all stages of lactation (early, mid and late lactation), the optimum milk production to balance for is about 1.25 X pen average milk yield (St-Pierre and Thraen, 1999) but you do NOT increase estimated DM intake based on the increased milk yield. For example, if the average cow in a pen is 150 days in milk and produces 70 lbs. of milk on average we expect her to eat about 51 lbs. of DM. When formulating the diet for the pen, provide enough RUP to meet the requirements of a cow producing 70 x 1.25 = 88 lbs. of milk but keep estimated DM intake at 51 lbs. In the era of high feed costs and low milk prices, that safety factor might not be optimal but at the current time, we do not know what the optimal value is. Grouping cows based on stage of lactation will allow lower safety factors for RUP. For a group of cow past peak dry matter intake the RUP safety factor could be reduced to about 1.15 X pen average milk yield. The early lactation group (up to approximately 4 weeks of lactation) should be fed at 1.3 X pen average milk yield. In theory, NEL should be fed at the requirement for the average cow in the pen plus any desired change in body condition (i.e., no safety factor). The reason for this is that if cows are fed more energy than required, DM intake decreases so that NEL intake is maintained. Because of all the errors in calculating NEL, it should probably be slightly overfed based on the average cow in the pen. However, the best guide for establishing the safety factor for NEL is to evaluate body condition score. If cows are too thin, increase energy density slightly. If cows are too fat, decrease energy density. Whatever adjustments are made, bear in mind the potential effects they might have on DM intake.
Feed Wastage and Shrink
Feeds that spoils during storage or are wasted during feed mixing or by the cow costs the same as the feed that was consumed by a cow. Feed shrink (feed lost or spoiled during storage) and waste (feed lost during feed delivery and while in the feed bunk) can be as high as 20% (Brouk, 2009). This means that if your cows consume 1000 tons of feed DM in a year, as much as 200 additional tons were lost via shrink and waste. To reduce shrink, follow good silage making practices (harvest at correct DM concentration, chop at correct length, fill quickly, pack well, and cover the bunker with plastic). Some silage additives can also effectively reduce shrink. Reduce shrink of other feeds by protecting them during storage, feed out fast enough (for example wet brewers or wet distillers usually should be fed within 7 days of delivery) and ensure that feeds are the proper DM when delivered to the farm (for example a load of concentrate that is 82% DM rather than 88% will probably mold and should not be accepted).
Waste can be reduced by proper silo face management (when removing silage from the silo, do not disturb the face any more than necessary and only remove as much silage as will be fed that day). Properly designed and maintained feed bunks will reduce waste (head locks reduce feed waste, while breaks in the curb and holes in the feed bunk increase waste). Over filling feed bunks and offering too much feed over a day increases waste. In most situations feed refusals for a pen of lactating cows should average about 2% of what was fed but if bunk space is limited or if diets are high in starch (high risk for acidosis) the amount of overfeeding should be increased. Diets that are too dry or have a wide variety of particle sizes (for example, long hay, concentrate, and silage) lead to more waste by the cows.
References
Brouk, M. 2009. Don’t let shrink kill you with high feed prices. Pp 227-232 in Proc. Western Dairy Mgmt Conf. Reno NV.
Colmenero, J. J. O., and G. A. Broderick. 2006. Effect of dietary crude protein concentration on milk production and nitrogen utilization in lactating dairy cows. J. Dairy Sci. 89:1704-1712.
Hansen, S. L., J. W. Spears, K. E. Lloyd, and C. S. Whisnant. 2006. Feeding a low manganese diet to heifers during gestation impairs fetal growth and development. J. Dairy Sci. 89:4305-4311.
National Research Council. 2001. Nutrient requirements of dairy cattle. 7th rev. ed. ed. Natl. Acad. Press, Washington DC.
Reynal, S. M., and G. A. Broderick. 2005. Effect of dietary level of rumen-degraded protein on production and nitrogen metabolism in lactating dairy cows. J. Dairy Sci. 88:4045-4064.
St-Pierre, N. R., and C. S. Thraen. 1999. Animal grouping strategies, sources of variation, and economic factors affecting nutrient balance on dairy farms. J Anim Sci. 77 (Suppl. 2):72-83.
Weiss, W. P., and M. T. Socha. 2005. Dietary manganese for dry and lactating Holstein cows. J. Dairy Sci. 88:2517-2523.
Table 1. Replacement herd size required to maintain a 100 cow herd (assumed a 10% cull/death rate for growing heifers)1.
Table 2. Average cost of nutrients for the Northern Florida feed market from January 2012 through December 2012 calculated using SESAME software.
Table 3. Bargain and overpriced feeds calculated from nutrient costs in Northern Florida feed markets from January, 2012 through December, 20121.


.jpg&w=3840&q=75)