Models for Estimating Duodenal Amino Acid Flow and Total Tract Digestibility of Starch
Published: April 22, 2015
By: Robert A. Patton / Nittany Dairy Nutrition, Inc.
Over the past 30 years, the concept of establishing requirements and evaluating nutritional adequacy by use of nutritional models for dairy cattle has taken over the feed industry. Private companies, universities, feed companies, governments and even individual nutritionists have developed models. It will be the purpose of this paper to look at some concepts governing nutritional modeling, recommend some techniques for evaluating a model, and look at a few specific examples of comparisons among models.
The Disclaimer
I am not a researcher or academic. I am foremost a working nutritionist, but secondarily, I have developed several models for dairy rations. This makes me innately prejudiced—not for or against certain models, but for or against certain ways of looking at the modeling process.
What is a model?
In its most simple form, a model is a mathematical description of a physical or biological process (McNamara, 2004). That is to say that a heifer grows at 1.64 lbs per day. However, we can quickly say that the process is more complicated than that. We know for example that the heifer grows at different rates at different stages of her life; we know that the energy and protein content of the diet will allow her to grow at different rates; we know that if the environment is cold, or hot or dirty, all of this will be changed. Therefore, the model of heifer growth needs to be much more complicated. Model complexity is basically of 2 broad types: (1) the deterministic in which one modeled effect (for example, ruminal starch digestion) leads to another effect (production of VFA); random effect (or stochastic) in which a random portion of starch is digested ruminally and a random portion of this leads to a random amount of VFA produced). An example of the first is the NRC (2001) model which models everything by association of linear and non-linear regression. An example of the second would be the Molly model developed at UCal-Davies by Dr. Lee Baldwin and his students which looked at nutrient and intermediary pools and rates of reaction of basic biochemical reactions to arrive at cow performance. There is a general perception that the dynamic models is more desirable because it more clearly mimics what occurs in biology. However, in speaking generally, this requires a state of knowledge concerning the biology of the cows which we may not have. By the rules of mathematics if there are 100 equations to model a function, without the complete knowledge of how these equations relate to each other, the set of equations must invariable vary to a number that is the average. So while it looks like it very sophisticated knowledge, it may well be as accurate to use a point estimate (or the average) of these effects. Models have two basic uses. The original use was to describe a process so that it could be dissected, studied and understood. The knowledge in this type of model is speculative. Another type is based on more certain knowledge and is used to describe a complicated system that can change in time or space. Depending on his interests the working nutritionist can find either of these model types—from the most complicated to the most simple.
There are two other traits shared by all models: (1) models are imperfect, some would say wrong and (2) models are constantly changing. We live in a world of incomplete information and competing theories. The developer of any model must take into account these factors and make, judgments about the relative correctness of any theory and any set of data. These are the assumptions that every modeler must make. And we need to question the assumptions or at least be aware of what they are. And no matter what a modeler may select for inclusion or inclusion for a model, it will never completely mimic animal biology. Likewise, as in any developing science, the information available changes and as the information becomes more exact, this will be added to the knowledge base of the model. We are sure that some or all of the models evaluated by our analyses have changed since the study was performed. The trick of changing models is, of course, to add information that really improves the accuracy of the model and not be reacting to each individual study on one hand while not waiting until all aspects are proven and the model has outgrown its usefulness on the other hand..
How to judge a model?
The single, overwhelming method of judging a model is, how well does the animal perform like the model? That is to say the model should be developed tested with real cows and not just with in vitro studies. Let us give two simple examples. Thousands of dollars are spent each year on in vitro testing for rates of starch degradability and NDF digestibility. Both of these degradation rates are then entered into the model of Orskov and MacDonald (1979) as below:
Ruminal digestibility % = nutrient weight x (kd / kd + kp) *100
This information was entered into the NittanyCow (NC) and CPM for about 30 literature studies. In this study the NDF digestibility was adequately predicted for grasses and legumes, but it was over predicted for corn silage samples by 22% for CPM and 17% for NC (Patton, unpublished). Likewise, when we looked predictions of ruminal starch degradation they were over predicted by nearly 40% by both AMTS and CPM (Patton et al., 2012). It was at this conference several years ago when Dr. Mike Allen noted the same relationship (Allen, 2011). His suggestion was that the rate of passage (kp) was being under estimated, whereas our suggestion was that the kd (rate of digestion) was being over predicted because of the uniform grind size in the in situ determination. . In the end, it may prove that a combination of factors is responsible. Perhaps the question that should be asked is, does the Orskov equation really describe the kinetics of rumen degradation?
Also, it is important to keep in mind that the model does not stop with the rumen. A good model will integrate the by-products of rumen fermentation and those substances that by pass rumen fermentation, and integrate them with intestinal, hepatic and mammary metabolism in order to both generate requirements and evaluate the effects of individual feeds and nutrients on the overall productivity of the animal. A less obvious but just as important factor is, has the appropriate standard been used for comparison? This is not so simple because it is easy to miss the critical measurement. The title of this paper is one example where the phrase “total tract digestibility of starch” is used. Do we really care about total tract digestibility—which was found to be accurately predicted by all models? Because of the potential for ruminal acidosis, the effect that the amount of propionate and glucose that are produced by different parts of the digestive tract, what is really important to know are: (1) what part of the starch is degraded ruminally; (2) what portion is digested in the small intestine and (3) what portion is degraded in the hindgut where only a small portion of the VFA could make a contribution to the overall glucose metabolism of the cow. If we look in the literature we will find many studies that measure apparent digestibility of starch. As we will discuss, the models we examined predicted this ‘total tract’ digestion quite accurately. So if that was our only evaluation we could say all the models predicted spectacularly. But this is not what we really wanted to know. We need to know how much was degraded in the rumen and how much was digested in the intestine. Less digestion in the rumen will mean a lower risk of acidosis and more glucose available from the starch digested in the small intestine (Reynolds, 2006).
Once the appropriate variable has been measured, then there are more rigorous, statistical means of evaluating how robust a model can be. For most of us who are ‘casual’ readers of science (in the sense that we do not rigorously explore every study on a subject), a model with a smaller mean square predicted error (MSPE) is better than one that predicts higher. It is important to know that the root mean square error (the square root of MSPE) should be below 15% of the mean (RPE) to have respectable predictive value, and preferably less than 10%. That is to say, a model could have lower MSPE than other competing models, but because of a RMSE as percent of the mean of over 20%, it may still not be a very good model. The model should predict the mean of the sample population as closely as possible and that the range of the predicted range should match as closely as possible without over extending the range. It is desirable to have an intercept of the linear equation as close to zero as possible and the slope of the equation close to one (Tedeschi, 2006). Lastly, it is possible to resolve the MSPE into a mean bias, a slope or regression bias and random error. Models that have mean bias and slope bias of less than 10% are more desirable and that random disturbance or random error should account for at least 80% of the total error (Bibby and Toutenburg, 1977) Models normally display various combinations of these. So one may predict the range, but over predict the mean for example. When using various studies, and making study a random effect, the correlation coefficient (R2) is really an effective discriminatory technique.
The statistical technique that makes all of this possible is the development of the meta-analysis. While a description of this statistical procedure is well beyond this paper, suffice it to say that this procedure allows the combining of studies with more or less the same design or same outcome to be combined. By taking out the effect (i.e., error and unknown factors) of a study, it is possible to aggregate all the results so that a “net effect” can be determined. The interesting part of this technique is that a treatment can be significant over a range of studies but which may not be significant in an individual study. Obviously, the greater number of studies which are included the more confident one can be that the effect is real. In general with 10 studies, general trends can be detected. With 50 studies there can be a high degree of certainty and with 100 studies, the results are virtually assured.
Model comparisons
Duodenal flows of protein and essential amino acids
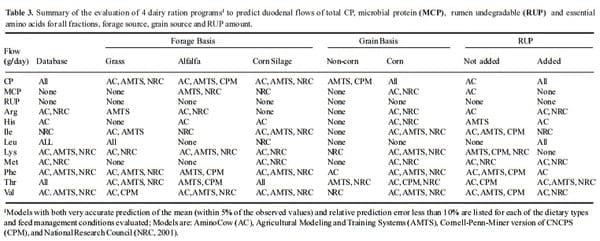
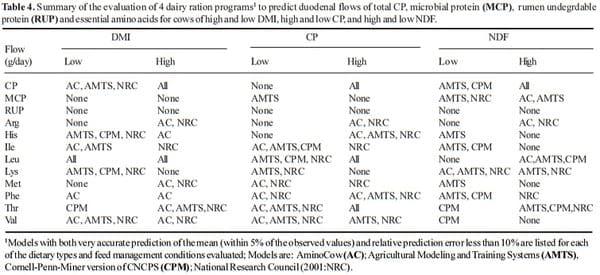
The final dataset consisted of 40 studies that represented 154 individual dietary means which were gleaned from all studies in milking cows that had sufficient data on body weight, milk production and ration ingredients that the ration could be reconstructed and where actual DMI was reported (Pacheco et al., 2012). All studies were conducted in doubly cannulated cows (i.e., at both the rumen and the duodenum) and were of short duration (usually less than 4 weeks). Diets were entered into AminoCow version 3.5.2 (AC), Agricultural Model and Training Systems version 2.0.15 (AMTS); Cornell-Penn-Miner version 3.0.1 (CPM), and the 2001 model of the National Research Council (NRC). These models were selected because at the time of the study they were readily available and widely used commercially. When ingredient composition was given in the study this composition was used; when the ingredient analysis was not provided, the NRC values for each feedstuff were used. This occurred mainly for grains and for small inclusion ingredients. When only the nutrient composition of the total diet was given, the forages in the diet were adjusted so that the total ration agreed with the reported nutrient density. Therefore all models contained the same exact dietary information, including crude protein, with the exception that protein fractions, passage rates and degradation rates were the program defaults. Comparisons were between the flow of CP, microbial protein (MCP), RUP, and essential AA (Arg, His, Ile, Leu, Lys, Met, Phe, Thr and Val) reported in the study and that predicted by the models. Treatments were further segmented into dietary forage sources (grass, corn silage, and alfalfa based diets), carbohydrate source (corn versus non-corn based diets), RUP source (added versus no RUP source), high (>48.5 lb/d) and low dry matter intake (<37.5 lb/d), low CP (14.6±1.2%) or high CP (18.3±0.95), as well as high (38.3±4.9%) and low (27.1±2.1%) dietary NDF.
The ability of each model to predict the mean of protein and AA flows across the total dataset is presented in Table 1. All models predicted the flow of total CP very accurately. CPM over-predicted microbial crude protein (27%), and under predicted the flow of RUP (24%), while the other models predicted these flows within 10% of observed. CPM over-predicted the flow of Met (25%), Lys (13%) and Arg (31%) while AMTS over-predicted the flow of Met (12%) and Arg (24%). For both models other AA were within 10% of what was observed), whereas AC and NRC predicted the flow of all AA within 10%.
Statistical evaluation for predictions across all diets, is presented in Table 2 for MCP , RUP, Met, Lys, His and Arg. Briefly, with the exception of the AC model for predicting MCP and NRC and CPM for predicting RUP, the RMSPE errors are amazingly close. Generally the NRC model displayed the lowest intercept and the slope closest to 1, suggesting that this was the better model. CPM had a random disturbance term lower than 75% and generally had a large mean bias for those components investigated. Overall, except for CPM, the other models predicted reasonably well across all diet types.
The data looks slightly less encouraging when looking at different diet scenarios. Tables 3 and 4 present a summary of all diet types tested and lists the models that predicted within 5% of the mean (i.e., was accurate) and whose RPE% was less than 10% (i.e., was precise). It should be obvious that there was no perfect model. It is particularly disturbing that no model predicted non-corn rations well nor did any model predict the amount of RUP flow for any diet combination. Across all possible combinations in this study (168) the best model only was accurate and precise 50.6% of the time. But clearly all models are useful for diet construction, even the CPM which although not accurate is precise and the mean bias indicates that so long user is aware that it over predicts flows of MCP and AA, the model can be adjusted in order to achieve satisfactory performance.
Ruminal Degradation and Total Tract Digestion of Starch
Similarly to the protein dataset, studies were gathered from all sources that reported sufficient data to reconstruct the diet, production, bodyweight and both ruminal starch degradation and total tract digestion. Diets on a dry matter basis were entered into models using the same technique as above. The model entitled ‘OFF’ was constructed as an Excel spreadsheet using the equations of Offner and Sauvant (2004) while that labeled SM_NC is a ‘simple method,’ also calculated as an Excel spreadsheet, where any given starch source is considered to contribute all the starch to the total reported digestibility or that it is complete in digestible. This established the maximum starch digestibility and the minimum and the average is taken. With enough samples, a mean and range is established as well as the opportunity to look at the effect of DMI on starch digestion. (Please see Patton et al., 2012, for a full description of this process). In the end there were 41 studies with 161 diets. Two of the studies were with dry cows. Starch sources included 83 diets based on corn, 58 diets based on small grain and only 8 diets based on sorghum.
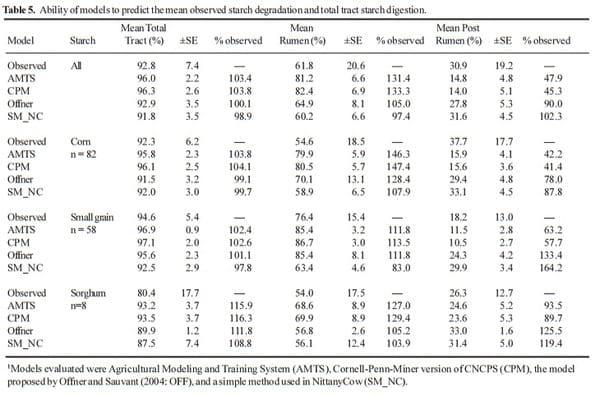
Ability to predict the mean observed total tract, rumen and post-ruminal digestion (total intestinal) for all diets, corn based diets only, small grain based diets and sorghum based diets is presented in Table 5. Please notice that for each diet type, the predictions of total tract starch digestion are rather close for all the models, except that starch digestion of sorghum in was over estimated by all models. The AMTS and CPM models considerably over-predicted (25-40%) the amount of starch degraded in the rumen, and because of this, under predicted starch digested post ruminally. The OFF model closely predicted the mean ruminal degradation across all diets and for sorghum diets, but considerably over-predicted degradation in corn and small grain based diets. SM_NC closely predicted ruminal digestion across all diets, corn and sorghum but considerably under predicted starch degradation in diets whose starch source was small grain. This model also over predicted the amount of post-ruminal starch digested for small grains and sorghum. No model captured the range in either rumen degradation or post-ruminal digestion.
Model statistical comparisons are present in Table 6 for all diets for total tract, rumen and post-rumen digestion, but rumen and post-rumen data only for corn, small grain and sorghum diets. What this shows is that none of the models tested are really robust for predicting anything except total tract starch digestion. It may be argues that the OFF and SM_NC are slightly better than either of the Cornell Net Carbohydrate Protein System (CNCPS) based models, but this would be self delusion. All of the models have huge inaccuracies in terms of intercepts slopes and the amount of error due to random disturbance.
Several more things are of interest in this study, however. First, we found that ruminal starch degradation was depressed across all diet types from 75% when starch consumption was less than 2 lbs to about 60% when starch intake was greater than 10 lbs. We also could find no effect of DMI per se, but only the amount of starch in the diet, an not as a percent of starch, but a weight of starch. This result is contrary to the studies of Firkins et al. (2001) and Offner et al. (2003). More studies will be required in order to separate these effects. Second as reported by both Nocek and Tamminga (1991) and Firkins et al (2001), starch particle size had the biggest effect on the variability of starch digestion, yet starch particle size data was rarely reported and when it was reported, it was not on a consistent basis. At least a portion of the failure of models to adequately predict starch degradation could be due to the lack of consistent particle size data. It is clear that if researchers want to adequately study ruminal starch degradation they must provide particle sizedata. In any case if seems futile for nutritionists to ask for test of starch degradability when we really do not have fruitful ways of using this data in models.
The dry matter intake dilemma
While it is fair and correct to evaluate models, the misuse of these same models is far more perplexing. This is especially true in the case of DMI predictions. We looked at these in the study of Pacheco et al. (2012) and found that the actual DMI was within 3.3 lbs only 61, 50, 49 and 58% of the time for intake predicted by AC, AMTS, CP and NRC, respectively. Because of the effect of this much dry matter difference on the flow of nutrients to the rumen and to the duodenum, as well as on the production of MCP, it seems a bit disingenuous to try to pick “the best” model when the difference between actual and predicted DMI would more than overwhelm differences predicted by models. If nutritionists are serious about using the technology of AA balance and ruminal starch degradation, they must first endeavor to determine the true dry matter intake for the groups of cows for which they are balancing rations. Using a single herd TMR, where DMI is widely divergent, may be one reason that AA balance technology has not advanced (Patton, 2009 ), in spite of relatively good accuracy of prediction by models.
Final considerations
There seems to be a growing trend that the more complicated, the more inputs a model requires the better it will predict a given biological outcome. If we take a look only at the models for protein and AA flow, three levels of complexity are represented: AC which uses only 1 term to describe the amount of RUP and rumen escape AA. NRC which uses three terms (totally degraded, totally degraded, and potentially degraded) and the CNCPS models use 5 fractions (a totally degraded, a totally undegraded and a potential degraded fraction that is subdivided into 3 parts). Given the result in hand, it does not appear that adding greater fractionation of the protein is providing better prediction of RUP flow, MCP or AA flow than the competing models. In the future it may turn out that we need more fractions, but a present it seems to be adding unneeded complexity.
Conclusions
Available models, excepting perhaps CPM, can with reasonably accuracy and precision predict the flow of protein and AA to the small intestine. However, competing models are reasonably poor at predicting ruminal and total tract starch digestion with precision. Significant work needs to be performed for small grain based diets in terms of improving prediction of both AA flow and starch degradation. Starch digestion trials must report starch particle size if progress toward more accurate predictions will be made.
Presented at the 22nd Tri-State Dairy Nutrition Conference.
References
Allen, M.S. 2011. Mind over Models. Pp29-43 in Proceeding of Tri-State Dairy Nutrition Conference, Fort Wayne Indiana. Published by The Ohio State University.
Bibby, J., and H. Toutenburg. 1977. Chapter 1:Basic ideas. Pages 16-19 in Prediction and Improved Estimation in Linear Models. John Wiley & Sons, London, UK.
Firkins, J.L., M.L. Eastridge, N.R. St-Pierre, and S.M. Noftsger. 2001. Effects of grain variability and processing on starch utilization by lactating dairy cattle. J. Anim. Sci. 79(E. Suppl):E219-E238.
Offner, A. and D. Sauvant. 2003. Prediction of in vivo starch digestion in cattle from in situ data. Animal Feed Sci. Technol. 111:41-56.
MaNamara, J.P.2004. Research, improvement and application of mechanistic, biochemical dynamic models of metabolism in lactating dairy cattle. Anim. Feed Sci. Technol. 112:155-176.
Nocek, J.E. and S. Tamminga. 1991. In situ and other methods to estimate ruminal protein and energy digestibility: A review. J. Dairy Sci. 74:3598-3629.
Offner, A. and D. Sauvant. 2003. Prediction of in vivo starch digestion in cattle from in situ data. Animal Feed Sci. Technol. 111:41-56.
Offner, A., A. Bach, and D. Sauvant. 2003. Quantitative review of in situ starch degradation in the rumen. Anim.Feed Sci. Technol. 106:81-93.
Ørskov, E.R. and I. McDonald. 1979. The estimation of protein degradability in the rumen from incubation measurements weighted according to rate of passage. J. Agric. Sci. (Camb.) 92:499-503.
Pacheco, D., R.A. Patton, C. Parys, and H. Lapierre. 2012. Ability of commercially available dairy ration programs to predict duodenal flows of protein and essential amino acids in dairy cows. J. Dairy Sci. 95:937-963.
Patton, R.A. 2009. The strategic use of ruminally protected amino acids in dairy nutrition. Proceeding of 2009 Florida Ruminant Nutrition Symposium, pp39-51.
Patton, R.A., J.R. Patton, and S.E. Boucher. 2012. Defining ruminal and total-tract starch degradation for adult dairy cattle using in vivo data. J. Dairy Sci. 95:765-782.
Reynolds, C.K. 2006. Production and metabolic effects of site of starch digestion in dairy cattle. Anim. Feed Sci Technol. 130:78-94.
Tedeschi. L.O. 2006. Assessment of the adequacy of mathematical models. Aric. Syst. 89:225:247.
Related topics
Authors:

Join to be able to comment.
Once you join Engormix, you will be able to participate in all content and forums.
* Required information
Would you like to discuss another topic? Create a new post to engage with experts in the community.
Create a post
AMTS Agricultural Modeling & Training Systems
22 de abril de 2015
I am surprised that this is being posted as a 'current' article. As stated, it was presented at the 22nd Tri-State nutrition conference (2012 I believe). This does NOT represent the current version of AMTS or the underlying CNCPS model. While CPM, Dairy NRC, and other models have not been updated, the CNCPS has undergone multiple changes in the last several years and I urge readers of this article, and this comment, to review recent Cornell Nutrition Conference proceedings regarding the updates.
T.P. Tylutki PhD
President AMTS LLC


You may be interested in
.jpg&w=3840&q=75)