INTRODUCTION
In calf rearing systems, an early and high intake of concentrate and roughage is encouraged to ensure a better development of the forestomach. In order to achieve this goal, high concentrate diets are fed with free availability of good quality forage after weaning the calves to achieve greater growth rates (Moran, 2002). The effects of age, weaning, and different diets, especially during pre-ruminant stage on metabolic changes and physiological adaptation is not well understood in ruminants. Moreover, the development of the function of the reticulorumen in calves is established at 24 wk of age, not at 13 wk as suggested by Hayashi et al. (2006), so understanding the metabolic status during this period is essential for calf production.
Glucose homeostasis is considered a crucial determinant of metabolic status that affects the performance of dairy calves. To minimize the adverse consequences of glucose shortage, nutritional strategies to improve glucose homeostasis is an important area of research in calves as they are in a state of perpetual gluconeogenesis. Also, plasma levels of metabolites change with aging (Hayashi et al., 2006). Feeding and managing dairy calves is expensive, requires extensive labour and contributes significantly to farm expenses. To maximize nutrient utilization and to improve feed conversion efficiency, limit-feeding is utilized as a management practice that effectively controls feed intake (Murphy and Loerch, 1994; Galyean, 1999). Energy intake could also be controlled by limit-feeding a more nutrient-dense diet. Limit-feeding may reduce feed cost and nutrient excretion which are of great concern in the dairy industry (Hoffman et al., 2007).
Restricting concentrate reduces energy intake, nutrient excretion and feed cost. On the other hand, feeding low energy, high-fibre forages effectually controls energy intake and reduces over-conditioning (Hoffman et al., 2007). It has been known for some time that diets containing high proportions of concentrate are utilized with greater efficiency than those containing high proportion of forages (Garrett, 1979). The hypothesis of this study was that reducing the amount of concentrate from 1.8 kg/day to 1.0 kg/day would partially be compensated by encouraging the intake of forage, leading to a moderate decrease of the growth intensity of the calves but possibly also altering the metabolic status. The present study evaluated the effect of limited concentrate feeding on growth performance, plasma variables, and mRNA expression of gluconeogenic enzymes in the liver of dairy calves.
MATERIAL AND METHODS
Animals, housing and feeding trial
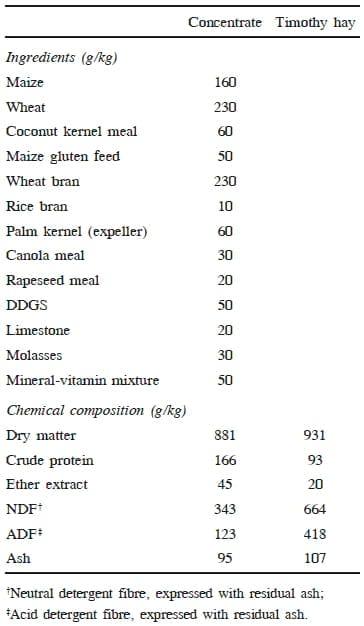
Twelve 100 days-old male dairy (Holstein) calves were utilized for the experiment at Kangwon National University Animal Experimental Facility, Chuncheon, South Korea. The calves were randomly divided into two equal groups based on BW. The calves in control group (CON) were fed 1.8 kg/calf/day of concentrate, whereas calves in the feed restricted (FR) group only received 1.0 kg/calf/day. In addition, calves had ad libitum access to Timothy hay along with their allocated portion of concentrate. It is a normal practice to feed 1.8 to 2.0 kg/calf/day of concentrate with free availability of forage to dairy calves until breeding in the majority of dairy farms in Kangwon province, South Korea. The calves were offered weighed quantities of hay. The quantity of hay offered was adjusted to about 120% of the previous day's intake. Feed residues, if any, were weighed the following day before offering fresh hay in order to determine the daily voluntary intake of forage for each group. The ingredient composition of the concentrate fed to both groups is given in Table 1 together with analyzed chemical composition of the concentrate and hay. The calves in both groups consumed all the daily allocated quota of their concentrate for the entire experimental period. Clean drinking water was available to the calves all the time. The animals were maintained on the above feeding schedule for 155 days.
The calves in each group were housed in well ventilated and cement-floored sheds with straw as bedding material. Concentrate and hay were offered manually. Calves were dewormed at the start by using broad-spectrum anthelmentics and were vaccinated against prevalent contagious diseases. The BW of individual calves were recorded at start and thereafter at fortnightly intervals until 155 days of the trial in the morning before feeding, in order to assess changes in BW and average daily gain (ADG). The animal experimental procedure and methods were approved by the animal welfare and ethics authority of Kangwon National University, Chuncheon.
Table 1. Composition (g/kg DM) of concentrate and timothy hay
Blood collection and analysis
Blood samples were collected from all animals in each group in the morning at 08.00 h before the feed was offered at days 0, 50, 100 and 155 of the trial from a jugular vein into tubes, with heparin as an anticoagulant. The anticoagulated blood samples were centrifuged at 1,200 x g for 20 min at 4°C to separate the plasma. The plasma samples were stored at 20oC until further analysis for glucose, total protein, albumin, urea, triglycerides, amylase, aspartate aminotransferase (AST), and alanine aminotransferase (ALT) using multitype reagents (Arkray Inc., Japan) by an automated chemistry analyzer system (Spotchem EZ SP-4430, Arkray, Saitama, Japan).
Analyses in feed
The proximate analyses of feeds were performed according to official methods of AOAC (1997). The DM of feedstuffs was determined by drying at 105°C and ash was estimated by ashing at 550°C overnight. The N was determined using the standard Kjeldahl procedure using Cu2+ as a catalyst and CP was calculated as N × 6.25.
Feed samples were analyzed for neutral detergent fibre (NDF; Van Soest et al., 1991) and acid detergent fibre (ADF, AOAC, 1997; method 973.18) and expressed with residual ash.
Liver biopsy collection and gene expression analysis
Liver biopsy collection
Liver biopsies were collected at days 100 and 155 of the trial from all animals in each group according to the procedure of Swanson et al. (2000). Briefly, the calves were restrained and sedated 20 minutes prior to the procedure and placed in left-lateral recumbency. The right caudo-thoracic area at an intercostal space between the 10th and 11th rib approximately 16 cm from the dorsal midline was shaved and washed with liquid disinfectant. Using local anaesthetics, a small incision (0.8 cm) in the skin was made with a surgical blade. The biopsy trocar was inserted through the incision penetrating the subcutaneous tissues, peritoneum and introduced in the liver parenchyma and samples from 3 different locations were collected at the same time. Around 500 to 600 mg wet sample weight were collected. After biopsy, the skin incision was applied with antiseptic agent and treated as open wound until healed. It took 2 to 4 h for calves to stand after biopsy and no complications due to biopsy procedure were observed in any calf.
Liver biopsy samples were collected in screw capped tubes and transferred in liquid nitrogen to the laboratory and stored at -80°C until measurement of mRNA expression of gluconeogenic enzymes, namely cytosolic phosphoenol pyruvate carboxykinase (PEPCKC; EC 4.1.1.32) and pyruvate carboxylase (PC; EC 6.4.1.1) by quantitative real-time polymerase chain reaction (qPCR).
RNA isolation
For mRNA quantification, TRIzol reagent (Sigma-Aldrich, Korea) was used for extracting total RNA. Briefly, frozen liver tissue was ground in liquid N and 20 to 30 mg was used for extraction. TRIzol reagent was added and RNA was isolated according to the protocol of the supplier, followed by DNase digestion in solution using RNasefree DNase set (Qiagen, Korea). Total RNA purification was performed using RNeasy Mini Kit (Qiagen). The quality of the purified RNA was tested by measuring optical density ratios at 260 and 280 nm and also by gel electrophoresis using ethidium bromide as stain.
Synthesis of complementary deoxyribonucleic acid (cDNA)
The synthesis of cDNA was performed using 1.8 μg of total RNA with Revert Aid reverse transcriptase (RT) (Fermentas, Korea) and 50 pmol random hexamer primers (Sigma-Aldrich, Korea). No-RT controls were created by omitting reverse transcription. No-template controls were created by adding nuclease-free water.
Quantification of mRNA
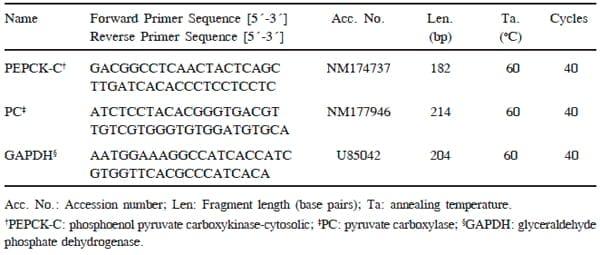
The amount of mRNA of the different candidate genes was quantified using qPCR (Cycler Mx 3000P, Stratagene, Amsterdam, The Netherlands) as reported by Lemor et al. (2009). The features of the primers used for quantification are presented in Table 2. For PEPCK-C, PC and glyceraldehyde phosphate dehydrogenase (GAPDH) the primers were used as mentioned by Hammon et al. (2003) and Lohakare et al. (2012). Copy numbers for each transcript were calculated from standard curves, based on purified and sequenced amplicons. Melting curve analysis confirmed the presence of a single product for qPCR assay. The reaction was performed in a total volume of 10μL composed of 2μL of template diluted 1:4, 1μL of the assay-specific primer mix, 5μL of the SYBR Green JumpStart Taq Readymix (Sigma-Aldrich, Korea), and 2μL double-distilled water. All samples were measured in triplicate. No-template controls were performed using nucleasefree water. In addition, no-RT and no-template controls from the cDNA synthesis were used to check for contamination. Quantification of mRNA was performed relative to the serial dilution of PCR amplicon standard curve, normalized against the reference gene (GAPDH). Data were expressed as ratios of the genes of interest to the reference gene.
Statistical analysis
The data generated during the study were analyzed using one way analysis of variance. The means were subjected to test of significance by Tukey's test using SPSS (16.0 version). For plasma variables and gene expression studies, group and time (period) were fixed effects and animals were treated as random effects. When an interaction was observed between main effects, the period effect was further separated using the TUKEY adjustment. Differences among means with P<0.05 were accepted as representing statistically significant differences and differences among means with 0.05<P<0.10 were accepted as representing tendencies to differences.
Table 2. Primer sequences and conditions used for qPCR
RESULTS AND DISCUSSION
Feed intake, body weight changes and growth
Average daily intake of the concentrate mixture per calf was as intended (Table 3), showing a lower concentrate intake in the calf of FR than the CON group. Similarly, and as expected, the daily forage intake per calf was higher for the FR than the CON group. The average daily DM intake per calf was higher in CON than FR group and so the CP intake (Table 3). The relationship between energy intake and energy retention is nonlinear such that maximum feed efficiency does not occur at maximum intake. Encouraging forage intake is also not beneficial because of lower digestibility of most forages, greater metabolic protein and energy requirements associated with digesting forage (Reynolds et al., 1991), and higher feed costs per unit of energy as compared to concentrates (Zanton and Heinrichs, 2007). The optimal strategy would be to feed high nutritive value forages to young dairy calves along with concentrate while maintaining ADG.
Table 3. Average daily feed intake during the feeding trial
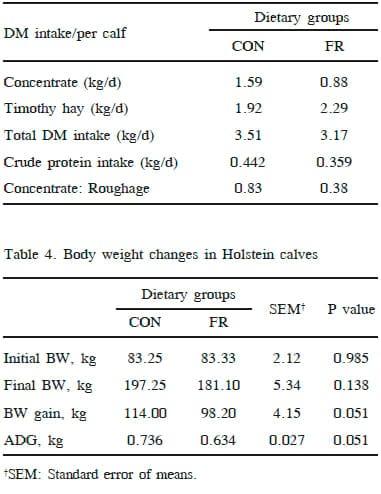
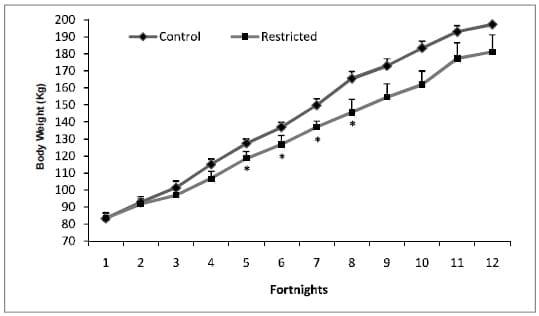
The BW of the calves at start and at the end of experiment was not statistically different (P>0.05) between the groups (Table 4). The BW gain in CON was 16 kg higher than those of the FR calves at the end which turned out to be significant (P=0.05). The ADG was 736 g in the CON, which was also greater than the ADG of calves in the FR group (634 g). Fortnightly BW measurements were not different between groups until 5th fortnight, however, higher (P<0.05) BW were recorded in CON than FR calves from 6th fortnight to 9th fortnight (Fig. 1). Even though higher BW were observed in calves in the CON at 10th and 11th fortnights (final BW weight) than FR group, but the differences were not significant. Restricting the concentrate (1 kg/ calf/day) and encouraging more good quality hay consumption in this study resulted in a slightly slower growth compared to CON calves fed 1.8 kg concentrate/day. The growth rate of CON calves in the current study was similar to that reported by Zanton and Heinrichs (2007) for highconcentrate fed calves. The intake of concentrate in CON and FR calves was complete without any left over each day for the whole period depicting no individual variation in both groups. The intake of forage was higher in FR calves than the CON as expected.
Fig. 1. Body weight changes in calves at fortnightly intervals *(P<0.05).
An ADG of greater than 700-800 g for the whole period of CON calves is considered appropriate for large breed dairy heifers to maximize first lactation milk yield as suggested by Zanton and Heinrichs (2005). As compared to our earlier studies (Lohakare et al., 2012), the ADG was lower in both the groups by approximately 100 grams and the differences could be attributed to the amount of concentrate and the types of forages. In that study, CON group was fed 2 kg/calf/day concentrate and the forages were maize and grass silages. The greater fibre concentration of the restricted diet could have lowered the ADG values compared with the CON in the present study. The CP and ME requirements of the CON group were met mostly by the intake of energy-dense concentrate. The higher daily intakes of CP and DM of the CON calves concomitantly resulted in higher ADG and BW gain compared with the FR group.
Blood biochemical profile
The plasma levels of glucose did not differ between the groups (Fig. 2a) and were all within the normal range (Lumsden et al., 1980; Fürll, 2005). The plasma glucose levels tended to be lower (P=0.094) at the start (0 day) than at other days and it increased subsequently in both groups. There was an increase in serum glucose levels in both groups with increasing age (period effect, P<0.0001), in our earlier study (Lohakare et al., 2012). Haga et al. (2008) reported that plasma glucose levels were lower around weaning (8 weeks) but then increased at 13 and 19 weeks of age that corresponds well with the present results. Probably weaning stress along with lower concentrate intake could be the reason for lower plasma glucose at the start in both groups. There was no interaction between groups and periods with respect to plasma levels of glucose in the present study. Around weaning, the rates of irreversible loss and recycling of glucose decreased suggesting that glucose is preferably used as the energy source in suckling calves (Hayashi et al., 2006). This might also be the case in the preruminant calves. Higher plasma glucose levels in subsequent periods would suggest that calves in both groups were well adapted to feeding regime and could have a better ability to utilize glucose.
The plasma levels of total protein did not show any variation due to dietary treatments (Fig. 2B). No period effect was observed on the plasma levels of total protein with increasing age in both groups. A similar trend of no differences between groups was evident for plasma albumin levels but it was lower (P=0.02) at day 50 than at day 155, but no group and period interaction was noticed (Fig. 2C). Lower levels of plasma albumin at day 50 suggested that the concentrate intake were not sufficient to achieve higher levels of albumin at this time period. For albumin, higher levels (P=0.02) were noticed at day 155 than at day 50 in both groups, but was not different than days 0 and 100. An increase in protein intake due to higher concentrate intake has been reported to increase serum albumin (Shetaewi and Ross, 1991) that might be a possible reason for increased plasma albumin levels in our study at day 155.
Plasma urea concentration did not differ between the groups (Fig. 2D). When compared among periods, higher (P<0.001) plasma urea levels were observed in CON and FR group at day 50 than other sampling dates but all values were within the normal range (Lumsden et al., 1980; Fürll, 2005). Serum urea concentrations are influenced by a wide variety of interrelated variables including dietary CP intake and rumen degradability, dietary amino acid composition, protein intake relative to requirement, liver and kidney function, muscle tissue breakdown, and dietary carbohydrate amount and effective rumen degradable protein intake (Eicher et al., 1999). Higher serum urea levels were observed in CON than FR group in our earlier studies (Lohakare et al., 2012) probably attributing to higher protein degradation and not been properly utilized in the rumen. Higher urea and lower plasma albumin levels at day 50 is suggestive of impaired protein degradation but exact reasons remained unclear.
Plasma triglycerides levels tended to be higher (P=0.07) in FR than CON group (Fig. 2E) and this might be the effect of diets but more studies are required on large number of animals before the importance of these findings can be assessed. However, there were no period effects or any interaction between groups and periods. Plasma triglycerides levels in calves in other studies showed no consistent change with age (Sivakanesan and Mariathasan, 1996; Hugi and Blum, 1997) in accordance with the results of the present study.
Amylase is found in intestinal mucosa and liver as well as in the pancreas. However, the serum amylase level is derived mainly from the pancreas. The amylase levels in plasma were neither affected by the dietary treatments nor were any period effects showing no interaction between groups and periods (Fig. 2F), demonstrating normal functioning of the pancreas in calves of both the groups in this study.
Fig. 2. Effect of limited concentrate feeding on plasma levels of glucose (A), total protein (B), albumin (C), urea (D), triglycerides (E), amylase (F), aspartate aminotransferase (G) and alanine aminotransferase (H). NS: not significant.
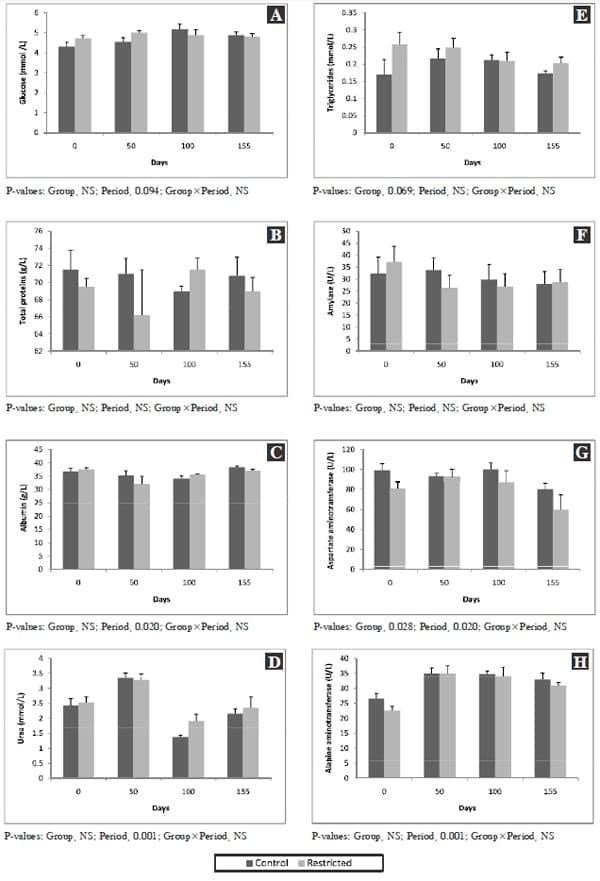
Aminotransferases acts as a catalyst in connecting the metabolism of amino acids and carbohydrates. Accordingly, changes in their activity in the blood can be a consequence of their increased activity in cells (primarily liver), but also a reflection of cell structure damage. In the liver AST, ALT show high activity and are most often determined if there is a suspicion of acute and chronic liver disease. Increased AST activity in the serum is a sensitive marker of liver damage, even if the damage is of subclinical nature (Meyer and Harvey, 1998; Stojevic et al., 2005). The AST levels in plasma was higher (P<0.05) in CON than FR group and there were period effects (P=0.02) showing lower levels at day 155 than other days (Fig. 2G). Kaneko et al. (1997) mention the value of plasma AST activity in cows as 105±27 U/L, and AST values reported by Kauppinen (1984) for a group of healthy cows are 65.1±31.3 U/L. Our values fall in this range and it is considered that the described changes are a reflection of metabolic events.
The ALT levels in plasma did not differ between the groups, however, lower levels were observed at day 0 than at days 50, 100, and 155 showing the effects of advancing age (Fig. 2H). Both primary and secondary hepatic disease can cause increased ALT levels, if altered cell membrane permeability or necrosis occurs. Usually ALT values exceed AST values in liver disease. The ALT values in the present study matches well with that reported by Kaneko et al. (1997) of 27±14 U/L. Age of the animal and energy status have an influence on tested values in our study.
mRNA expressions in liver
The PC and PEPCK enzymes are rate limiting enzymes for gluconeogenesis (Greenfield et al., 2000), and thus play an important role in energy metabolism. The mRNA expression of PC enzyme relative to the reference gene was not different between the groups in the present study, however, PEPCK-C mRNA levels tended to be higher (P=0.08) in CON than FR group (Table 5). It was hypothesized that reduction in feed intake could decrease blood glucose levels in animals in the FR group and might prompt gluconeogenesis in liver to meet the metabolic glucose requirements, but this was not proved. The unchanged mRNA expression for PC indicates that no extra energy requirement through gluconeogenesis in FR calves had to be covered as plasma glucose levels were within the normal range. Contradictory results of showing a tendency for increased mRNA expression of PEPCK-C in the CON than FR group remained unclear. High inter-individual differences in mRNA expression of these enzymes in cows were recently described by Van Dorland and Bruckmaier (2010) which was also observed in the present study. These authors observed no differences between samples collected from different locations within the liver of one animal. We therefore expected similarities in the samples from repeated liver biopsies from the same animal, but variance between animals in relation to PEPCK-C expression might mask differences between diets. There were no period effects in gene expression of these gluconeogenic enzymes at days 100 and 155 indicating that concentrate intake had no effect. However, PC mRNA expression decreased with age and PEPCK-C mRNA expression was higher at 13 weeks of age as compared with other measurements (1, 3, 8 and 19 weeks of age; Haga et al., 2008).
Table 5. Effect of limited concentrate feeding on mRNA concentrations† of phosphoenol pyruvate carboxykinase (PEPCK) and pyruvate carboxylase (PC) in liver by RT-PCR relative to the reference gene (GAPDH)
We did not measure the expression of mitochondrial PEPCK-M as it is supposed not to be regulated by metabolic changes in mammals (Hanson and Reshef, 1997) including cattle (Agca et al., 2002).
CONCLUSIONS
Calves fed restricted concentrate partially compensated by increased intake of forage. Restricting concentrate moderately reduced the growth intensity with-out affecting the normal plasma indices and gene expression indicating that restricting concentrate feeding scheme could be applied in dairy calves.
ACKNOWLEDGEMENTS
The funding provided by National Research Foundation, Korea under the grant number C 1007297-01-01 (120100382) to carry out this project is gratefully acknowledged. Partial financial support by Institute of Animal Resources at Kangwon National University is also duly acknowledged.
REFERENCES
Agca, C., Greenfield, R.B., Hartwell, J.R. and Donkin, S.S. 2002. Cloning and characterization of bovine cytosolic and mitochondrial PEPCK during transition to lactation. Physiological Genomics, 11: 53-63.
AOAC. 1997. Official Methods of Analysis, 16th ed. Association of Official Analytical Chemists, Arlington, VA, USA.
Eicher, R., Liesegang, A., Bouchard, E. and Tremblay, A. 1999. Effect of cow specific factors and feeding frequency of concentrate on diurnal variations of blood metabolites in dairy cows. American Journal of Veterinary Research, 60: 1493-1499.
Fürll, M. 2005. Klinische labordiagnostik in der tiermedizin. Spezielle Untersuchungen beim Wiederkäuer. Schattauer, Stuttgart. Germany.
Galyean, M.L. 1999. Review: restricted and programmed feeding of beef cattle – definitions, application, and research results. The Professional Animal Scientist, 15: 1-6.
Garrett, W.N. 1979. Relationships among diet, metabolizable energy utilization and net energy values of feedstuffs. Journal of Animal Science, 49: 1402-1409.
Greenfield, R.B., Cecava, M.J. and Donkin, S.S. 2000. Changes in mRNA expression for gluconeogenic enzymes in liver of dairy cattle during the transition to lactation. Journal of Dairy Science, 83: 1228-1236.
Haga, S., Fujimoto, S., Yonezawa, T., Yoshioka, K., Shingu, H., Kobayashi, K., Takahashi, T., Otani, Y., Katoh, K. and Obara, Y. 2008. Changes in hepatic key enzymes of dairy calves in early weaning production systems. Journal of Dairy Science, 91: 3156-3164.
Hammon, H.M., Sauter, S.N., Reist, M., Zbinden, Y., Philipona, C., Morel, C. and Blum, J.W. 2003. Dexamethasone and colostrum feeding affect hepatic gluconeogenic enzymes differently in neonatal calves. Journal of Animal Science, 81: 3095-3106.
Hanson, R.W. and Reshef, L. 1997. Regulation of phosphoenol pyruvate carboxykinase (GTP) gene expression. Annual Review of Biochemistry, 66: 581-611.
Hayashi, H., Kawai, M., Nonaka, I., Terada, F., Katoh, K. and Obara, Y. 2006. Developmental changes in the kinetics of glucose and urea in Holstein calves. Journal of Dairy Science, 89: 1654- 1661.
Hoffman, P.C., Simson, C.R. and Wattiaux, M. 2007. Limit feeding of gravid Holstein heifers: effect on growth, manure nutrient excretion, and subsequent early lactation performance. Journal of Dairy Science, 90: 946-954.
Hugi, D. and Blum, J.W. 1997. Changes of blood metabolites and hormones in breeding calves associated with weaning. Journal of Veterinary Medicine, Series A, 44: 99-108.
Kaneko, J.J., Harvey, W. and Bruss, M.L. 1997. Clinical Biochemistry of Domestic Animals, 5th ed. Academic Press, San Diego, pp. 890-894.
Kauppinen, K. 1984. ALAT, AP, ASAT, GGT, OCT, activities and urea and total bilirubin concentrations in plasma of normal and ketotic dairy cows. Zentralblatt Fur Veterinarmedizin Reihe A, 31: 567- 576.
Lemor, A., Hosseini, A., Sauerwein, H. and Mielenz, M. 2009. Transition period-related changes in the abundance of the mRNAs of adiponectin and its receptors, of visfatin, and of fatty acid binding receptors in adipose tissue of high-yielding dairy cows. Domestic Animal Endocrinology, 37: 37-44.
Lohakare, J.D., Van der Sand, H., Gerlach, K., Hosseini, A., Mielenz, M., Sauerwein, H., Pries, M. and Südekum, K.H. 2012. Effects of limited concentrate feeding on growth and blood and serum variables, and on nutrient digestibility and gene expression of hepatic gluconeogenic enzymes in dairy calves. Journal of Animal Physiology and Animal Nutrition, 96: 25-36.
Lumsden, J.H., Mullen, K. and Rowe, R. 1980. Haematology and biochemistry reference values for female Holstein cattle. Canadian Journal of Comparative Medicine and Veterinary Science, 44: 24-31.
Meyer, D.J. and Harvey, J.W. 1998. Veterinary Laboratory Medicine: Interpretation and Diagnosis. W.B. Saunders, Philadelphia (PA), pp. 157-187.
Moran, J. 2002. Calf Rearing: A Practical Guide, 2nd ed. Landlinks Press, Collingwood, Victoria, Australia. Murphy, T.A. and Loerch, S.C. 1994. Effects of restricted feeding of growing steers on performance, carcass characteristics, and composition. Journal of Animal Science, 72: 2497-2507.
Reynolds, C.K., Tyrrell, H.F. and Reynolds, P.J. 1991. Effects of diet forage-to-concentrate ration and intake on energy metabolism in growing beef heifers: whole body energy and nitrogen balance and visceral heat production. Journal of Nutrition, 121: 994-1003.
Shetaewi, M.M. and Ross, T.T. 1991. Effects of concentrate supplementation and lasalocid on serum chemistry and hormone profiles in Rambouillet ewes. Small Ruminant Research, 4: 365-377.
Sivakanesan R., Mariathasan P., 1996. Age related changes in some biochemical constituents of blood in growing buffalo calves. In: Proceedings of the 2nd Asian Buffalo Association Congress, (ABAC'96), Manilla, Philippines, pp. 422-429.
Stojevic, Z., Pirsljin, J., Milinkovic-tur, S., Zdelar-tuk, M. and Ljubic, B.B. 2005. Activities of AST, ALT and GGT in clinically healthy dairy cows during lactation and in the dry period. Veterinarski Arhiv, 75: 67-73.
Swanson, K.S., Merchen, N.R., Erdman, J.W. Jr., Drackley, J.K., Orias, F., Douglas, G.N. and Huhn, J.C. 2000. Technical note: A technique for multiple liver biopsies in neonatal calves. Journal of Animal Science, 78: 2459-2463.
Van Dorland, H.A. and Bruckmaier, R.M. 2010. Regional mRNA expression of key gluconeogenic enzymes in the liver of dairy cows. Journal of Animal Physiology and Animal Nutrition, 94: 505- 508.
Van Soest, P.J., Robertson, J.B. and Lewis, B.A. 1991. Methods for dietary fiber, neutral detergent fiber, and non-starch polysaccharides in relation to animal nutrition. Journal of Dairy Science, 74: 3583-3597.
Zanton, G.I. and Heinrichs, A.J. 2005. Meta-analysis to assess effect of prepubertal average daily gain of Holstein heifers on first-lactation production. Journal of Dairy Science, 90: 3860-3867.
Zanton, G.I. and Heinrichs, A.J. 2007. The effects of controlled feeding of a high-forage or highconcentrate ration on heifer growth and first-lactation milk production. Journal of Dairy Science, 90: 3388-3396.






.jpg&w=3840&q=75)