Chemical Characterisation of Shrubs Browses from Salt Affect Soils and Pothohar Plateau in Pakistan for their Nutritional and Anti-nutritional Compounds
Published: January 21, 2014
By: M. Riaz1, A.S. Chaudhary2 and Syed Hassan Raza1
Department of Livestock Management, University of Agriculture, Faisalabad.
Dept. of AFRD, University of Newcastle Upon Tyne, UK
Introduction
Pakistan is comprised of large number of livestock population with a contribution of more than half 50 % value added share in the agricultural GDP. Livestock are the back bone of the socio-economic structure of the small land holders in the rural areas of the country (Raza and Rowlinson 2004; Raza et al., 2000 and Sultan et al., 2007, ). The land allocation for livestock production is continuously reducing due to the farmer‘s preference for urgently needed cash crops and urbanization. The pastures are continuously converted into croplands leaving no land for livestock utilization (Pratt et al., 1997). Therefore, an acute shortage of green biomass was observed both in irrigated plain areas as well as in mountainous arid regions (Roy et al., 1989). Consequently, animals are facing severe deficiency both in energy and protein by 26% & 38%; respectively (Riaz et al., 2008). The lowered productivity of livestock in tropical regions is hence attributed to the inadequate and poor quality animal feeds (Saleem et al., 2006). Indigenous livestock farming had been heavily dependent on seasonal fresh green biomass availability (cut & carry system). Presently livestock farmers in the country left with no other option than to feed their valuable cash crops during the fodder scarcity seasons, just to sustain the body needs of their family farm animals (Riaz et al., 2008). The waste or abandoned lands due to salinity, water logging or other soil hazards in addition to other un-commanded uphill ranges would become one of the potential land resources for range livestock production. Some drought resistant plants, shrubs and saltbushes are found adapted with sufficient green biomass production potential in the said conditions. The several shrubs and trees have shown their potential to supplement the traditional feeds without any detrimental effects on growth and production of range livestock (Ondiek et al., 2000).
Trees & shrubs’ foliages may have higher levels of secondary metabolites i.e., alkaloids, saponins and tannins which are generally basic component of diets of range livestock (sheep, goats or camels) in the arid regions of the tropical countries. The multipurpose trees and shrubs vegetation had shown the potential to alleviate some of the feed shortages and nutritional deficiencies experienced in the semi-arid or arid harsh conditions particularly during fodder scarcity seasons (Papachristou and Nastis, 1996; Salem et al., 2006, FAO, 1992; Topps, 1992). Several earlier workers from different ecological regions reported that trees and shrubs leaves (browses) contained substantial amount of certain anti-nutritional compounds, mainly tannins in addition to other secondary metabolites (Makkar and Becker, 1998; Salem, 2005; Reed, 1986; Aganga and Mosase, 2001; Dube et al., 2001), which may reduce their nutritional value (Salem et al., 2004b). The current review over the subject suggested a dire need for the chemical characterization and in vitro fermentation for a nutritional evaluation of the halophytic browses.
The present study was designed to investigate the nutritional profile of shrub browses commonly found in Pakistan. Four species of shrubs’ foliages comprising of two (Adhatoda vasica & Dodonaea viscosa) from the hilly semi-arid regions and two species (Acacia ampliceps & Atriplex lentiformis) acclimatized to the salt affected waste soils of the arid to irrigated areas of the Punjab-province in Pakistan, were randomly selected for their nutritional characterisation & for other anti-nutritional compounds and mineral profile in the foliages.
Materials and methods
1- Shrubs browse samples
The browse samples comprising of small twigs and leaves were hand plucked from the five plants of each of the four species of bushes randomly selected from a particular area/ plot. The browse forage of the shrubs included an Australian Kiker (Acacia ampliceps) and saltbush (Atriplex lentiformis) which have proved themselves as the strong candidates for salt affected waste soils, were taken from the experiment field of “Nuclear Institute for Agriculture and Biology (NIAB) Faisalabad-Pakistan” in “Pakka Anna”. Faisalabad is situated at 31º- 26 º latitude and 73 º- 60 º longitudes at 184 m elevation. The agro-ecological zone was arid with 300-400 mm average annual rain fall, having brackish sub soil water. Australian Kiker (Acacia ampliceps) and saltbush (Atriplex lentiformis) were amongst the successful stories so far the adaptability trials were concerned. They were taken as the representative for shrub vegetation from salt affected waste soils of central Punjab province in Pakistan. The other two shrubs were Sanatha (Dodonaea viscosa) and Baker (Adhatoda vasica), well adapted to northern mountainous hilly areas of Punjab (Pothohar plateau). It is situated at 457 to 610 m altitude with average rainfall 1143mm (Semi-arid) annually having 24.4-35 ºC average temp in summer and 4.0 to 16.6 ºC in winter.
2- Nutrient analysis
The sun dried browse samples of the trees, bushes and the grass nut (taken as control) were further dried in a forced draught oven at 60?C and finally ground in a Wiley mill to pass a 1 mm sieve before the chemical analysis. The ground samples were analysed for dry matter (DM), organic matter (OM), ether extracts (EE) and ash (AOAC, 2006). Nitrogen was analysed by the Nitrogen analyzer: Leco Model FP- 528 and %CP was determined (crude protein% =% N*6.25) The browse samples were also analysed for neutral detergent fibre (NDF), acid detergent fibre (ADF) and acid detergent lignin (ADL) as by Van Soest et al., (1991). Nitrogen free extract was calculated by the equation; %NFE= 100-(%CP+ %CF + %EE+ % Ash). The metabolisable energy (MJ/kg DM) was calculated by using the following equation adopted from Menke et al. (1979), Menke and Steingass (1988).
ME (MJ/kg DM) = 2.20 + 0.1361 IVGP24 (ml/0.5g DM) + 0.057 CP (% DM) Where IVGP was 24hr gas volume and CP (%DM) was that of the tree leaves.
3- Anti-nutrient compounds
The anti-nutritional components such as total phenols and condensed tannins were examined by the calorimetric method described by Makkar et al (1993) & Makkar (2003).
4- Total phenol determination:
Total phenol content was determined by the Folin-Ciocalteu method (Singleton and Rossi, 1965) as described by Khadambi (2007). The 0.125 g of respective sample was suspended in 6.25 ml of 75% aqueous acetone in test tubes. Then tubes were vortex mixed at five minutes intervals for two hours and twenty minutes using a vortex mixer. The aliquots amounted 1 ml of each extract was mixed with 5ml of Folin-Ciocalteu reagent in 100 ml volumetric flasks were then made up to volume with deionised water. After standing for two hour at room temperature, the absorbance was read at wavelength of 760 mm in the visible range of the spectrum using a UV/ vies-spectrophotometer. The estimation of total phenols in extracts was carried out in duplicate for all samples.
5- Saponins determination:
Saponins were analysed by the method of Hiai et al. (1976). The respective sample (0.5 g) was stirred overnight in 10 ml of 80% aqueous methanol using a magnetic stirrer. The contents were centrifuged at 3000 rpm for 10 min and supernatant collected in 25 ml volumetric flask. The residues were washed three times, each time with 5 ml of 80% aqueous methanol followed by centrifugation. The supernatant was taken in the mentioned volumetric flask and the volume was made 25 ml with 80% aqueous methanol. An aliquot (0.5 ml) was taken for saponins determination.
6- Condensed tannin determination:
The condensed tannin was determined according to Khadambi (2007) and Osman (2004). For the determination of CT extracts were prepared by suspending of 0.125 g of the samples in 6.25 ml of acidified methanol (1% HCL in 100ml of methanol) in test tubes. The contents of test tubes were vortex mixed at five minutes at five minutes intervals for two hours using a vortex mixer and centrifuged for six minutes at 3000 rpm. After centrifugation, extracts were assayed for CT. Vanillin HCL reagent was prepared by mixing, prior to use, equal volumes of 8% HCL in methanol with 2% vanillin in methanol. One ml of supernatant was mixed with 5 ml of vanillin HCL reagent. The absorbance was read at 500 nm after 20 h incubation at room temperature. Catechin was used as standard and the results obtained were expressed as mg catechin equivalent/g of sample on DM basis.
7- Oxalates determination:
Oxalic acid (mg)/100g sample was determined as described by Harinder et al. (2007) and original principles of AOAC (2006), and Baker (1952). The oxalic acid content from the samples were extracted with HCL and precipitated as calcium oxalate. After complete washing and draining of the precipitate calcium oxalate was treated with dilute sulphuric acid to form a solution of oxalic acid. It was then quantified by titration with standard KMnO4 (Harinder et al., 2007).
8- Mineral analysis:
About 1 g dried and ground sample was placed into a Kjeldahl tube and 20 ml pure HNO3 were added for the determination of mineral contents in the tree & shrub browses samples. The sample was digested in Kjeldahl digestion chamber at 100?C and the digested samples were diluted to the original volume of 20 ml with water. The samples were filtered through Whatman filter papers no 541 and the concentrations of selected minerals were determined with inductively coupled plasma optical emission spectroscopy (ICP-OES) with Unicam 701 ICP-OES. Machine was calibrated over the relevant concentrations using individually certified standards obtained from Sigma-Aldrich, UK.
Statistical analysis: All of the data were generated in duplicate for chemical analysis and for the secondary metabolites on dry matter basis was subjected to analysis of variance techniques (Steel and Torrie, 1984), by using General Linear Model of Mini Tab. Tuckey’s test was used for the comparison of the means at the significance (P<0.05) or (P<0.01) level. The in vitro degradability (IVDMD), pH, total gas production, CH4, and NH3 data were also analyzed by using General Linear Model of Mini tab and Tuckey’s test was used for the comparison of the means at the significance (P<0.05) or (P<0.01) level to study the main effects of shrub browse forages in different duration of fermentation and their interactions respectively at each incubation time.
Results and discussion
Nutrient analysis
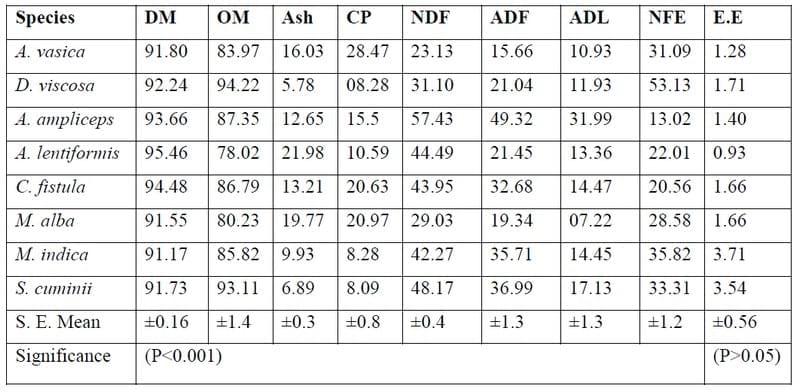
All of the samples were significantly (P<0.001) different in all nutrients from each other (table 1). The total ash % (21.98 ± 0.34) was significantly (P<0.001) higher in Atriplex lentiformis (A. lentiformis) followed (16.03± 0.34) by Adhatoda vasica (A. vasica) and Acacia ampliceps (A. ampliceps), respectively. The OM% (94.22 ± 1.36) significantly (P<0.001) higher in Dodonaea viscosa (D. viscosa) followed by A. ampliceps and A. vasica. The CP contents in all of the trees & shrubs browses tested were in the range (8.09% - 28.47%) of minimal level of DM to support the maintenance of range livestock as the US National Academy of Sciences (1975) suggested that more than 8% CP is required for the maintenance of sheep. Milford and Haydock (1965) also indicated a minimal CP level 7.2% of DM for the maintenance of sheep. Maximum CP% of DM was found in A. vasica (28.47± 0.8%) and significantly (P<0.001) varied from all other trees & shrubs foliages analysed in this study. The two shrubs grown on salt affected waste lands shown fair amount of CP (10.59% & 15.5) in A. lentiformis (Al) & A. ampliceps (Aa) respectively just above the minimal level of CP required for the sustenance of range livestock. Only D. viscose (Dv) showed 8.28 ± 0.8 % CP content. A. vasica browses contained > 20% CP content. The CP content in these shrubs was probably higher than the traditional range grasses and herbs available especially in the seasons of summer or autumn in tropical countries. Hence the CP in these shrubs foliages could be utilised in the feeding of livestock. The results were supported by Norton (1982).
The maximum (P<0.001) NDF % (57.43± 0.39) was found in A. ampliceps followed by A. lentiformis (44.49± 0.39) and D. viscosa (31.10± 0.39), respectively. The ADF & ADL values were also in the same sequence. The maximum values for the ADF & ADL were in A. ampliceps followed by A. lentiformis and D.viscosa, respectively. All of the samples of tropical shrub browse were significantly (P<0.001) differed from each other with respect to their chemical composition. Saleem et al. (2006) also analysed the chemical composition and secondary compounds of four species of the tree foliages and reported that the CP content ranged from 124 to 185 g/kg DM. The NDF (368-615), ADF (200-542) and ADL (101-192), reported by Saleem et al. (2006) were comparable to values observed in the present study. The slight difference might be due to the stage and or age of plants in different climatic conditions. Chernery et al., (1993) also found that NDF, ADF and ADL increased with increasing maturity in tropical grasses. Wilson (1977) also analysed four species of shrubs and four tree species for NDF (34-62%), ADF (20-41%) & ADL (9.7-14.3%) on OM basis and reported that ash % (16.4-29.5) was higher in shrubs than tree forage. Wilson (1977) conducted ash % (24.2 & 29.5) in two species of Atriplex (A. vasicaria & A. numularia). Craig et al. (1991) worked on the chemical composition as %age of DM of new shoots and mature phyllodes of Acacia ampliceps as one of the Acacia species tested from naturally saline areas and reported CP (16.6 & 11.9), NDF ( 35 & 44), ADF (21 & 35) and ADL (11 & 20) content respectively. The minimum (P<0.001) ME content were observed in A. lentiformis followed A. ampliceps, respectively. There was wide variation (P<0.001) observed amongst the bushes browses. The values for ME contents observed in this study were lower than the values observed by Khanum et al. (2007) for some of the grasses and traditional fodders. This might be due the genotypic variation of the novel tree or shrub browses from the traditional grasses or fodders used by Khanum et al. (2007).
The nutrient levels determined in the present study were also comparable to Craig et al. (1991), LeHouerou (1980), Tops (1992), and Rubanza et al. (2003). Khanum et al, (2007) worked on the chemical composition of grasses, cultivated fodders, salt tolerant plants, crop residues and browse plants and concluded that CF, EE and NFE contents for roughages ranged from 13.8 to 35.1%, 1.0 to 4.8% and 29.5 to 62.9%, respectively. The metabolisable energy varied significantly (P<0.001) amongst the shrub browses tested in this study (Table 3). A. vasica showed higher (P<0.001) ME (3.39 ± 0.03 MJ/kg DM) amongst the entire shrubs browses species tested in this study. Riaz et al., (2008), also revealed that for the economical livestock production, poor roughages and crop residues may be supplemented to traditional fodders up to 30% level instead of feeding the cash crops especially in fodder scarcity seasons, the findings of this study are also supported by Craig et al., (1991) who reported that in times of drought the bushes like A. ampliceps from saline lands could be supplemented in other traditional forages at least at the maintenance level.
Table 1. Chemical composition (g/100g DM) of tropical tree and shrub browse
Minerals profile
M. indica (9100±220) showed the maximum (P<0.001) values for Ca, followed by A.vasica (9064±220) and C. fistula (7952±220). S. cuminii revealed minimum (P<0.001) values for the Ca (2460 ± 220), P (164 ± 48), Na (96 ± 202), S (232 ± 104), Zn (3.88 ±1.62), Mn (5.96 ±3.95) and Fe (22.33 ±8.30) content (ppm) amongst the all species tree and shrub browse foliage tested. A. lentiformis depicted minimum (P<0.001) contents of the Ca (1028 ±220), K (2248 ±205) and Mg (726 ± 36) as compared to other tree or shrub browse foliage tested in this study. A. lentiformis also had significantly (P<0.001) lower values of Mn (5.73 ± 3.95), Cu (0.98 ± 0.38) and Se (1.03 ±0.65) as compared to other species tested.
Table 2.a Minerals (ppm) profile in the tropical tree, shrub browse foliage
Craig et al., (1991) also conducted the chemical composition of Acacia species from naturally saline areas and ash reported (10.8-14.6%) content comprising of P (0.17 & 0.10), Ca (1.43 & 2.13), and Na (0.92 & 0.96), and Mg (0.62 & 0.57) percent of DM having Ca: P ratio (8.4 & 21.3) in new shoots and mature phyllodes of Acacia ampliceps. Riasi et al., (2008) also concluded that the halophytic plants showed higher concentrations of Na, K, Cl, Cu and Se, and lowered levels of Ca, P and Mg. Gihad and El-Shaer (1992) also reported that saltbushes (Atriplex) showed a wide variation in mineral profile due to species differences, geographical regions, soil types and stage of harvesting. The optimum level of mineral profile in these trees and shrub browses shows their nutritional importance for different categories of range livestock. Macro and micro mineral elements are considered valuable for keeping the livestock health, even deficiency of a single element can not be masked over by the others (Abbasi et al., 2009). A wide range of benefits could be obtained by the production and inclusion of certain levels of trees and shrub browse foliages in the feed of range livestock in addition to nutrient recycling for the soil.
Table 2.b Minerals (ppm) profile in tropical tree, shrub browse foliage
The values of the mineral profile found in trees and shrub browses tested in this research project were in the range with comparable figures to the previous studies and in agreement to those reported by Riasi et al., (2008), Craig et al., (1991) and Gihad and El-Shaer (1992).
Secondary metabolites
The compositions of secondary compounds (Table 3) are also presented in Fig.1, for shrub browse foliages separately. Minimum (P<0.001) levels of CT were found in A. lentiformis (6.87± 0.72) followed by A. ampliceps (9.32 ± 0.72). The maximum (P<0.001) condensed tannin (g/kg DM) values (30.9± 2.9), and total phenols (73.2± 1.0) along with saponins (16.4 ± 2.0) were found in D. viscose (Fig.1) amongst the entire shrub species tested. The tree foliages were also statistically analysed separately from the shrubs. Among the tree browse foliage (Fig. 2.) the C. fistula was having minimum (P<0.001) saponins (1.3 ± 1.17) content amongst all of the tree leaves as well as in all of the shrub and tree browse foliages tested in this study. M. alba was found to have minimum (P<0.001) TP (13.1 ± 0.04) and CT (6.0±1.3) amongst the all browse foliage analysed in this research project. M. indica showed significantly (P<0.001) higher content (g/kg DM) for TP, CT and SAP (55.02±2.93, 103.14±1.03 & 86.35±1.98,) followed by S. cuminii (52.37±2.93, 80.88±1.03 and 10.55±1.98), respectively as compared to the other species of tree & bush browse foliages tested in this study.
The lowest (P<0.001) total phenol (6.0± 1.03) were observed in M alba followed by A. lentiformis (6.87±1.03). Maximum (P<0.001) TP content were found in M. idica (103 ±1.03) followed by S. cuminii (80.88±1.03). Minimum (P<0.001) CT (4.18 ± 2.93) were found (P<0.001) in (A. lentiformis) amongst the entire analysed browse samples. Craig et al., (1991) also found TP, CT and SAP values 44.3, 31.6 & 8.3 g/kg DM in the composition of E. camaldulensis & 102.3, 68.1 & 14.6 g/kg/DM in Acacia ampliceps from naturally saline areas, respectively. Saleem et.al, (2006) also observed the TP, CT, and SAP with in the range of 29.0-102.3, 20.8-68.1 & 3.0-14.6 g/kg DM, respectively in four tree foliages i.e., C. speciosa, C. fistula, S. molle and E. cameldulensis.
Table 3. Secondary compounds (g/kg DM) of some trees & shrubs browse foliage
The values for TP, CT & SAP 6.00-103.1, 4.18- 55.02 & 1.30-86.35 g/kg DM obtained in the present study are in agreement with the mentioned earlier workers. The trees showed higher values for the secondary compounds as compared to the shrub browse foliages studied in this project except D. viscosa which showed values comparable to trees. These tropical shrub browse have higher levels of secondary compounds as compared to certain other traditional forages might be due to their defensive mechanism against pest and predators, high environmental temperature and drought stress (Mangan, 1998). Shayou and Uden (1999) and Abdulrazak et al. (2000), reported similar findings (high TP & CT level) in some East African browses. High polyphenolic compounds were also reported in semi-arid of north Egypt (Saleem, 2005) and arid regions of Sudan (Fadel Elseed et al., 2002) and in agreement with the present study. Rubanza et al. (2003) revealed that TP and CT were between 65-237 and 6-74 g/kg DM, respectively in some tree foliages studied. The differences in values of the secondary compounds are attributed to different assays and assay standards in addition to certain variation in chemical composition of polyphenolic among foliages (Makkar and Becker, 1993),; Pino et al., 2005). Secondary compounds are reported as the main property of plant genotypic factors controlling physiological synthesis and accumulation of secondary compounds in drought resistant plants (Okuda et al., 1993; Kelman et al., 1997).
Conclusions
The tropical trees and shrub browse may become potential supplements to traditional forages for ruminants maintained on poor quality or quantity forages especially during scarcity seasons in tropical arid environments. In vivo study may be conducted to explore the potential DM intake and performance of animals maintained on a certain level of shrub browse substitution for the tradition fodder, grasses, straws and concentrates in addition to other range vegetation.
References
Abbasi, M. K., M. M. Tahir, A. H. Shah and F. Batool, 2009. Mineral nutrient composition of different ecotypes of white clover and their nutrient credit to soil at Rawalakot Azad Jammu and Kashmir. Pak. J. Bot., 41(1): 41-51.
AOAC, 2006. Official Methods of Analysis, 18th edition. AOAC International, Gaithersurg, MD, USA.
Abdulrazak, S.A., T. Fujihara, J. K. Ondiek and E. R. Ørskov, 2000. Nutritive evaluation of some Acacia tree leaves from Kenya. Anim. Feed Sci. Technol. 85: 89-98.
Annonymous, 2007. Economic Survey of Pakistan. Government of Pakistan, Economic Advisor’s wing, Finance division, Islamabad.
Animut, G., R. Pauchala, A. I. Goetsch, A. K. Patra, T. Sahlu, V. H. Varel and J. Wells, 2008. Methane emission by goats consuming diets with different tannins from lespedeza. Anim. Feed Sci. Technol. 144: 1212-227.
Aganga, A. A. and K. W. Mosase, 2001. Tannin content, nutritive value and dry matter digestibility of Lonchocarpus capassa, Zizyphus mucronata, Sclerocarya birrea, Kirkia acuminate and Rhus lancea seeds.Anim. Feed Sci.Technol, 91:107-113.
Baker, C. J. L., 1952. The determination of oxalates in fresh plant material. Analyst 77: 340-344.
Bento, B. H. L., T. Acamovic and H. P. S Makkar, 2005a.The influence of tannin, pectin, and polyethylene glycol on forages fed to ruminants. Br. J. Nutr. 81: 263-272.
Bergen, W. G. and D. G. Bates, 1984. Ionophores: Their effect on production efficiency and mode of action. J. Anim. Sci.58: 1465-1483.
Brooker, J. D., L. A. OiDonovan, I. Skene, K. Clarke, L. Blackall and P. Muslera, 1994. Streptococcus caprinus sp. nov., a tannin–resistant ruminal bacterium from feral goats. Lett. Appl. Microbiol.18:313-318.
Carulla, J. E., M. Kreuzer, A. Machmuller and H. D. Hess, 2005. Supplementation of Acacia mearnsii tannins decreases methanogenesis and urinary nitrogen in forage fed sheep. Aust. J. Agric. Res. 56, 961-970.
Cherney, D. J. R., J. H. Cherney and R. F. Lucey, 1993. In vitro digestion kinetics and quality of perennial grasses as influenced by forage maturity. J. Dairy Sci., 76: 790-797.
Chalupa, W., W. Corbett and J. R. Brethour, 1980. Effects of monensin and amichloral on rumen fermentation. J. Anim Sci.51:170-179.
Craig, G. F., D. T. Bell and C. A. Atkins, 1991. Nutritional characteristics of selected species of Acacia growing in naturally saline areas of Western Australia. Aust. J. Exp. Agric.31:341-345.
Dube, J. S., J. D. Reed and L. R. Ndlovu, 2001. Proanthocyanidins and other phenolics in Acacia leaves of Southern Africa. Anim. Feed Sci. Technol, 91:59-67.
European Union, 2003. Regulation (EC) No 1831/2003 of the European Parliament and of the Council of 22 September 2003 on additives for use in animal nutrition. Off. J. Eur. Union 10/18/2003: L268/29-L268/43.
Fadel Elseed, A. M. A., A. E. Anim, Khadiga, A. Abdel Ati, J. Sekine, M. K. Hishinuma and K. Hamana, 2002. Nutritive evaluation of some fodder tree species during dry season in central Sudan. Asian-Aust. J. Anim. Sci. 1:339.
Field , J. A., S. Kortekaas and G. Lettinga, 1989. The tannin theory of methanogenic toxicity. Biological wastes, 29:241-262.
Food Agriculture Organizatio (FAO), 1992. Legume trees and other fodder trees as protein sources for livestock. In: Speedy, A. and P. L. Pugliese (Eds.), Proceedings of the FAO Expert consultation. Malaysian Agricultural Research and Development Institute (MARDI) Kuala Lumpur, Malaysia: 339.
Goddard, R.C.U, A. P. Rees and N. J. P. Owens, 1996. Instruments and methods. Simultaneous0- high-precision measurement of methane and nitrous oxide in water and seawater by single phase equilibration gas chromatography. Deep sea research 1, 43(10):1669-1682.
Harinder, P. S., P. S Makkar and K. Becker, 2007. Methods in Moleular BiologyTM . In: “Plant Secondary Metabolites”. Institute for Animal Production in the tropics and subtropics, University of Hohenheium, Stuttgart, Germany: 35-38. Human press, Totowa, New Jersey.
Hiai, S., H. Oura and T. Nakajima, 1976. Colour reaction of some sapogenins and saponins with vanillin and sulphuric acid. Planta Medica 29: 116-122.
Kelman, W. M., M. J. Blumenthal and C. A. Harris, 1997. Geneticvariation for seasonal herbage yield, growth habit, and condensed tannins in Lotus pedunculatus Cav. and Lotus corniculatus. Aust. J. Agric. Res. 48: 959-968.
Khanum, S. A., T. Yaqoob, S. Sadaf, M. Hussain, M. A. Jabbar, H. N. Hussain, R. Kausar and S. Rehman, 2007. Nutritional evaluation of various feedstuffs for livestock production using in vitro gas method. Pak. Vet. J. 27(3): 129-133.
LeHouerou, H. N., 1980. Fourrages ligneux en Afrique du Nord. In: LeHouerou, H. N. (Ed), Les fourrages ligneux en Afrique. Etat actuel des connaissances. Clloque sur les fourrages ligneux en Afrique, Addis Abeba, Ethiopia: 57-84.
Mangan, J. L., 1988. Nutritional effects of tannins in animal feed. Nutr. Res. Rev. 1: 209-231.
Makkar, H. P. S. and K. Becker, 1993. Behaviour tannic acids from various sources towards some chemical and protein precipitation assays. J. Sci. Food Agric.62: 295-299.
Makkar, H. P. S, M. Blummel and K. Becker, 1995a. In vitro effects and interactions between tannins and saponins and fate of tannins in the rumen. J. Sci. Food Agric. 69: 481-493.
Makkar, H. P. S, M. Blummel, and K. Becker, 1993. Gravmetric dtermination of tannins and their correlations with chemical and protein precipitation methods. J. Sci Food Agric 61:161-65.
Makkar, H. P. S, 2003. Quantification of Tannins in Tree and Shrub Foliage: A Laboratory Manual. Kluwer Academic Publishers, London: 49-61.
Makkar, H. P. S, N. K. Brorowy, K. Becker and A. Degen, 1995b. Some problems in fiber determination of a tannin rich forage (Acacia saligna leaves) and their implications in vivo studies. Anim. Feed Sci. Technol. 55:67-76.
McMeniman, D. R. Niven, D. Crowther, R. J.W. Gartner and G. M. Murphy, 1981. Studies on the supplementary feeding of sheep consuming mulga (Acacia aneura). Aust. J. Exp. Agric. Anim. Husb. 21: 404-409.
McSweeney, C. S., B. Palmer, R. Bunch and D. O. Krause, 2001. Effect of tropical forage calliandra on microbial protein synthesis and ecology in the rumen. J. Appl. Microbiol. 90:78-88.
Mlambo, V., F. L. Mould, J. L.N. Sikosana, T. Smith, E. Owen and I. M. Harvey, 2008. Chemical composition and in vitro fermentation of tannin-rich tree fruits. Animal Feed Sci and Technol, 140:402-417.
Makkar, H. P. S. and K. Becker, 1998. Do tannins in leaves of trees and shrubs from African and Himalayan regions differ in the level and activity? Agroforest. syst. 40: 59-68.
Menke, K. H., L. Raab, A. Salewski, H. Steingass, D. Fritz and W. Schneider, 1979. The estimation of the digestibility and metabolisable energy contents of ruminant feedstuffs from the gas production when they are incubated with rumen liquor in vitro. J. Agri. Sci. Camb. 92: 217-222.
Menke, K. H. and H. Steingass, 1988. Estimation of the energetic feed value from chemical analysis and in vitro gas production using rumen fluid. Anim. Res. Develop., 28: 7-55.
Milford, R. and K. P. Haydock, 1965. Nutritive value of protein in subtropical pasture species grown in south-east Queenland. Aust. J. Ept. Agric & Anim. Husb. 5:13-17.
Moore, K. J. and H. G. Jung, 2001. Lignin and fibre digestion. J. of Range. 54: 420-430.
Norton, B. W., 1982. Differences between species in forage quality. In “Nutritional limits to Animal Production from Pastures” (Ed. J. B. Hacker): 89-110. (Commonwealth Agric. Bureaux: Farnham Royal, U. K.)
Okuda, T., T. Yoshida and T. Hatano, 1993. Classification of oligmeric hydrolysable tannins and specificity of their occurrence in plants. Phytochemistry 32: 507-521.
Ondiek, J. O., J. K. Tuitoek, S. A. Abdulrazak, F. B. Bareeba and T. Fujihara, 2000. Use of Lucaena leucocephala and Gliricida sepium as nitrogen sources in supplementary concentrates for dairy goats offered Rhodes grass hay. Asian-Aust. J. Anim. Sci. 13, 1249-1254.
Papachristou, T. G. and A. S. Nastis, 1996. Influence of deciduous broadleave woody species in goat nutrition during the dry season in Northern Greec. Small Rumin. Res. 20:15-22.
Pino, M. A., G. Hervas,A. F. J. Giraldez and P. Frutos, 2005. Comparison of biological and chemical methods, and internal and external standards, for assaying tannins in Spanish shrub species. J. Sci. Food Agric. 85: 583-590.
Pratt, D. J., F. L. Gall and C. D. Haan, 1997. Investing in pastoralism. International Bank of reconstruction and development. The World Bank 1818 H Street, NW Washington, D. C. 20433, USA.
Raza, S.H., A.Ullah, S.Khan and N. Teufel. 2000. Buffalo milk production by small, medium and large farmers and their response to different innovations in Punjab, Pakistan. 2000. Proceed. 3ed Asian Buffalo Congress, Sri-Lanka, March 27-31, 2000).
Raza, S.H. and P. Rowlinson. 2004. A study in to the Importance of Buffaloes in small holders Dairying in Pakistan.7th world Buffalo Congress, October 22-27, Philippines
Reed, J. D., 1986. Relationship among soluble phenolics, insoluble proanthocyanidins and fiber in east African browse species. J. Range Manage. 39:5-7.
Reed, J. S., 1995. Nutritional toxicology of tannins and related polyphenoles in forage legumes. J. Anim. Sci.73: 1516-1528.
Riaz, M., M. Ahmad, and M. Sarwar, 2008. Evaluation of sugarcane as an alternate fodder for Sahiwal bull calves during fodder scarcity in Pakistan. Int. J. Agric. Biol., 5: 526-530.
Riaz, M., M. Ahmad, M. Sarwar and S. H. Raza, 2008. Nutritional evaluation of sugarcane tops in conventional feeding management system during fodder scarcity season of Pakistan. Int. J. Agric. Biol., 6: 665-668.
Roy, D., K. A. Shankaranarayan and R. S. Pathak, 1989. The fodder trees of India and their importance. Indian Forester, 106: 306-311.
Rubanza, C. D. K., M. N. Shem, R. Ichchinohe and T. Fujihara, 2003. Nutritive evaluation of some browse tree legume foliages native to semi-arid areas in western Tanzania. Asian-Aust. J. Anim. Sci. 16; 1429-1437.
Salem, A. Z. M., 2005. Impact of season of harvest on in vitro gas production and dry matter degradability of Acacia saligna leaves with inoculation from three ruminant species. Anim. Feed Sci. Technol.123-124: 67-79.
Salem, A. Z. M., M. Z. M.Salem, Y. M. Gohar, M. M. El-Adawy and P. H. Robinson, 2006. Nutritive evaluations of some browse tree foliages during the dry season: secondary compounds, feed intake and in vivo digestibility in sheep and goats. Anim. Feed Sci. Technol.127:251-267.
Sarwar, M., M.A. Khan and Z. Iqbal. 2002. Feed resources for livestock in Pakistan. Int. J. Agr. Biol. 4(1):186-192.
Shayo, C. M. and P. Udden, 1999. Nutritional uniformity of neutral detergent solubles in some tropical browse leaf and pod diets. Anim. Feed Sci. Technol. 82: 63-73.
Steel, R. G.D and U. H. Torrie, 1984. Principal and Proceadures of Statistical: A Biometrical Approach (2nd edition):182. McGraw hill Book Co. Inc, New York, USA.
Sultan, J .I.., I. U. Rahim, H. Nawaz and M. Yaqoob, 2007. Nutritive value of marginal lands grasses of grasslands of Pakistan. Pak. J. Bot. 39(4): 1071-1082.
Tops, J. H., 1992. Potential, composition and use of legume shrubs and trees as fodder for livestock in the tropics. J. Agric. Sci. Camb. 118: 1-8.
United States National Academy of Sciences, 1975. Nutrient requirements of domestic animals. (5) Nutrient requirement of sheep 5th Ed. revised. N. R. C., Washington, D. C.
Van Soest, P. J., J. B. Robertson and B. A. Lewis, 1991. Methods for dietary fibre, neutral detergent fibre, and non-starch polysaccharides in relation to animal nutrition. J. Dairy Sci. 74: 3583-3597.
Van Soest, P. J, 1994a. ‘Nutritional ecology of the ruminant’ (2nd edition): 51-60.
Wilson, A.D, 1977. The digestibility and voluntary intake of the leaves of trees and shrubs by sheep and goats. Aust. J. agric. Res., 28:501-518.
Raza, S.H., A.Ullah, S.Khan and N. Teufel. 2000. Buffalo milk production by small, medium and large farmers and their response to different innovations in Punjab, Pakistan. 2000. Proceed. 3ed Asian Buffalo Congress, Sri-Lanka, March 27-31, 2000).
Raza, S.H. and P. Rowlinson. 2004. A study in to the Importance of Buffaloes in small holders Dairying in Pakistan.7th world Buffalo Congress, October 22-27, Philippines
Related topics
Authors:

Join to be able to comment.
Once you join Engormix, you will be able to participate in all content and forums.
* Required information
Would you like to discuss another topic? Create a new post to engage with experts in the community.
Create a post
22 de enero de 2014
it is a good effort to feed livestock shrubs of various kinds. it is very difficult in some parts of year to feed the livestock.o really appreciate the efforts of DR. HASSAN RAZA.

21 de enero de 2014
very informative article sir.

21 de enero de 2014
keeping in view the trend of farmers bringing more land under cultivation, there is dire need of seeing alternative sources having potential to b as important source of feed especially in worst condition like seasonal scarcity as well as after floods.
Syed Hassan Raza has done marvellous job but he kept himself restricted to few bushes while there r lot of bushes as well as trees which may b rightly called fodder trees. hope some other scientist will expand the scope of the subject...i must congratulate syed sb for this good work..pl keep it up


You may be interested in
.jpg&w=3840&q=75)
Balchem Animal Nutrition