Does feeding Bio-Mos® enhance immune system function and disease resistance in European sea bass (Dicentrarchus labrax)?
Aquaculture is the fastest growing food production sector and has greatly developed during the last 20 years. In marine fish culture, this development has been only possible through the intensification of production systems that have increased culture densities and fish handling, together with increasing stress conditions and pathogen susceptibility (Winton, 2001). Infectious diseases can markedly reduce economic profit by increasing sanitation costs and fish mortality and reducing production. Legislation restricting the use of antibiotics and the increased risk of resistant strains are promoting the use of dietary immunostimulants and probiotics (Verschuere et al., 2000).
Bio-Mos® (Alltech Inc.), composed of an extract from the cell wall of yeast (Saccharomyces cerevisiae) that is rich in mannan oligosaccharides, has been reported to modulate the immune response of fish species such as common carp (Cyprinus carpio) and rainbow trout (Oncorhynchus mykiss) (Staykov, 2004).
Feeding Bio-Mos® has been found to reduce mortality and improve antibody levels, bactericidal and lysozyme activity and alternative complement pathway (ACP) activity (Staykov, 2004). In other species (white sea bream larvae, Diplodus sargus) Bio-Mos® supplementation to Artemia induced a higher resistance to stress and improved intestinal microvilli structure (Dimitroglou and Davies, 2004). However, few studies to date have demonstrated effects of feeding Bio-Mos® on resistance to disease in fish.
Despite being one of the most important species in Mediterranean aquaculture, European sea bass (Dicentrarchus labrax) is a species particularly sensitive to stressors and infections, which occasionally cause very significant losses (Izquierdo, 2005).
Inclusion of Bio-Mos® in diets of European sea bass could improve stress resistance by stimulating the immune system. A series of trials were conducted to evaluate the effects of dietary Bio-Mos® in growing European sea bass on performance and immune response to pathogenic infection and whether such effects are dose dependent.
Materials and methods
DIETS
Two series of isonitrogenous and isoenergetic diets, based on a commercial formulation, were utilized. Diets met nutritional requirements for this species (Izquierdo, 2005) and were manufactured by a commercial feed producer (Graneros de Tenerife, Tenerife, Spain) with the composition indicated in Table 1. In Trials I, II, and III, three diets were designed to contain 0 parts per thousand (ppt) (Control), 2 ppt or 4 ppt Bio-Mos® replacing standard carbohydrates. In Trial IV, the same levels were tested together with 6 ppt Bio-Mos®.
Table 1. Main ingredients of the experimental diets.
1Peruvian fish meal (65% protein).
2Peruvian fish oil.
3TROUW Seabream/Seabass (0.8 g), choline chloride (0.17 g), inositol (0.06 g).
4TROUW Seabream/Seabass (1 g) calcium carbonate (0.2 g), potassium monophosphate (0.19 g), NaCl 97% (0.04 g).
EXPERIMENTAL DESIGN
Trial I
Eight hundred commercially reared European sea bass juveniles from a population that had suffered no apparent diseases and originated from a local farm (ADSA, San Bartolomé de Tirajana, Canary Islands, Spain), arrived at the main facility of the Canarian Institute of Marine Science (ICCM) on July 1, 2005. Fish were maintained in stocking tanks and fed a commercial extruded diet for 3 weeks (19-20.5 ºC) until well adapted to the environmental conditions.
Afterwards, 792 sea bass juveniles were randomly distributed in nine indoor, cylindrical 1000-L fibreglass tanks at an initial stocking density of 3 kg/ m3 (88 fish/tank). Fish average initial weight (g ± SD) and length (cm ± SD) were 33.75 ± 7.69 and 13.46 ± 0.97, respectively (n=792). Tanks were supplied with filtered sea water (1.39 L/min) at a temperature of 20.5-23.4 ºC, and natural photoperiod (12L:12D).
Dissolved oxygen was kept at 8.0 ± 0.2 ppm. Fish were manually fed until apparent satiation with one of the three experimental diets for 9 weeks (3 times a day, 6 days a week). Each diet was assayed in triplicate.
Feed intake was calculated daily and growth parameters were determined at days 0, 36 and 67. Food conversion ratio was defined as the amount of food ingested divided by the generated biomass; specific growth rate was defined as: [(ln final weight – ln initial weight)/number of days] x 100 and relative growth (%) defined as: [(final weight – initial weight)/initial weight)] x 100. Nine fish at the beginning of the trial and 15 fish per tank at day 67 were sampled after 24 hrs fasting to determine body proximal composition and studies of hepatic and enteric tissue morphology.
Blood samples (for plasma and serum) were taken from 15 fish at day 67 to determine nitroblue tetrazolium (NBT) index, lysozyme and ACP activities. In addition, the head kidney was removed from 15 fish per treatment to determine phagocytic activity of macrophages.
Trial II
After 9 weeks of feeding the experimental diets, 60 fish per dietary treatment from Trial I were randomly selected and distributed among 12 indoor cylindrical 500-L fibreglass tanks in the pathogen incubation facility (3 kg of fish/m3, 20 fish/tank). Each group of fish was fed the same diet as in Trial I.
Initial fish average weight (g ± SD) and length (cm ± SD) were 99.37 ± 21.84 and 18.71 ± 6.30, respectively. A bacterial analysis was performed before the beginning of the challenge test to ensure that fish were not infected by bacteria. Two groups of 20 fish from each dietary treatment (Control, 2 and 4 ppt Bio-Mos®) were exposed to a pathogen by cohabitation (3:1, healthy:infected) with fish intraperitoneally (IP) infected (2.4×10⁸ CFU/mL/fish) with Vibrio alginolyticus.
Another two groups of 20 fish per treatment were used as non-infected controls cohabitating (3:1) with fish IP-injected with sterile saline solution. Fish injected with Vibrio alginolyticus or sterile saline solution were marked by Visible Implant Elastomers (VIE, Northwest Marine Technologies, Shaw Island Washington, WA, USA) (Astorga et al., 2005). Water temperature ranged from 22.0 to 23.0 ºC during the trial and artificial light photoperiod was adjusted to 12L:12D. Fish were manually fed their respective experimental diets until apparent satiation for 21 days (3 times a day, 6 days a week).
At the end of this challenge trial all fish were slaughtered and microbiological analysis of head kidney, spleen and liver were conducted to determine the infection spread grade.
Trial III
In Trial III, 80 fish per dietary treatment from Trial I were randomly selected and distributed among 12 indoor cylindrical 500-L fibreglass tanks in the pathogen incubation facility (3.5 kg of fish/m3, 20 fish/tank). Each group of fish were fed the same diet as in Trial I.
Initial fish average weight (g ± SD) and length (cm ± SD) were 98.23 ± 5.63 and 18.51 ± 0.30, respectively. A bacterial analysis was performed before the beginning of the challenge test to ensure that fish were not infected by bacteria.
Two groups of 20 fish from each dietary treatment (Control, 2 or 4 ppt Bio-Mos®) were inoculated via anal canalisation with Vibrio alginolyticus (2.4 x 10⁸ CFU/mL/fish). Another two groups of 20 fish per treatment were inoculated via anal canalisation with 1 mL of sterile saline solution. Water temperature ranged from 22.0 to 23.0 ºC during the trial and artificial light photoperiod was adjusted to 12L:12D. Fish were manually fed their respective experimental diets until apparent satiation for one week (3 times a day, 6 days a week).
After 24 hrs and 48 hrs post-inoculation, 33% of the fish population was randomly selected and bacterial characterization of head kidney, spleen and liver was performed to determine the pathogen’s capacity to pass through the intestinal epithelium. Seven days after experimental infection, gut and liver samples were taken for histological studies.
Trial IV
Fifteen hundred commercially reared European sea bass juveniles from a population that had suffered no apparent diseases and originated from a local farm (ADSA, San Bartolomé de Tirajana, Canary Islands, Spain) arrived at the main facility of the ICCM on October 1, 2006. Fish were maintained in stocking tanks and fed a commercial extruded diet for 2 weeks (23-24.1ºC) until well adapted to the environmental conditions (7 kg/m3 stocking density).
Afterwards, 1,440 sea bass juveniles were randomly distributed in 24 indoor, cylindrical 500-L fibreglass tanks at an initial stocking density of 7 kg/m3 (60 fish/tank). Fish average initial weight (g ± SD) and length (cm ± SD) were 60.78 ± 5.43 and 16.57 ± 0.69, respectively (n=1440). Tanks were supplied with filtered sea water (1.5 L/min), at a temperature of 20-23.7 ºC, and natural photoperiod (12L:12D). Dissolved oxygen was kept at 6.2 ± 1.1 ppm. Fish were manually fed until apparent satiation with one of the three experimental diets for 8 weeks (2 times a day, 6 days a week). Each diet was assayed in triplicate.
Feed intake was calculated daily and growth parameters were determined at days 0, 30 and 60 as well as FCR and SGR. The head kidney of 15 fish per dietary treatment was removed at days 30, 45 and 60 after 24 hrs fasting to determine phagocytic activity of macrophages.
BIOCHEMICAL ANALYSIS
Feed and fish biochemical composition were determined following standard procedures (AOAC, 1995). Dry matter (DM) content was determined after drying the sample in an oven at 105 ºC to constant weight; ash by combustion in a muffle furnace at 600 ºC for 12 hrs; protein content (N × 6.25) was determined by Kjeldahl method and crude lipid was extracted following the method of Folch et al. (1957). Fatty acids from total lipids were prepared by transmethylation as described by Christie (1982) and separated by gas chromatography under the conditions described by Izquierdo et al. (1990). All analyses were conducted in triplicate.
HISTOLOGICAL STUDIES
Samples were fixed in 10% neutral-buffered formalin, embedded in paraffin and stained with hematoxylin and eosin (H&E) for optical examination (Martoja and Martoja-Pierson, 1970). Micrographs of liver were taken from the paraffin sections at a final magnification of 400× using a Nikon Microphot-FXA microscope and an Olympus DP50 camera.
Hepatocellular area as well as maximum and minimum longitude of cells using hepatocyte nuclei as a reference were measured with an ANALYSIS® (Image Pro Plus®) software package using arbitrary units. For each diet, 27 micrographs originating from nine fish (n=27) were analyzed. In Trial III, 7 days after experimental infection, gut and liver samples were taken for histological analysis and routinely processed.
BLOOD COLLECTION AND SAMPLE PREPARATION
Blood was obtained by caudal sinus puncture with a 1-mL plastic syringe. No anesthetic was used to avoid any possible effect on blood parameters; handling time was less than 1 min to minimize stress effects.
The first aliquot of blood was transferred to a coated Eppendorf tube with lithium heparin as anticoagulant and used for NBT index, measuring the activity of circulating neutrophils spectrophotometrically as described by Siwicki et al. (1993) and measuring the reduction of NBT to formazan in the presence of oxygen radicals. The second aliquot was divided into two portions, transferred to Eppendorf tubes and allowed to clot for 2 hrs. Serum was separated by centrifugation and stored at –80 ºC for subsequent determination of ACP and lysozyme activities.
SERUM ANALYSIS
Alternative complement pathway determination was performed as described by Sunyer and Tort (1995) for gilthead sea bream (Sparus aurata) using rabbit red blood cells (RBC). The reciprocal of the serum dilution causing 50% lysis of RBCs was defined as ACH50; the results are reported as alternative complement pathway-hemolytic titers (ACH50 units/mL). Lysozyme levels in blood serum were determined by turbidimetric assay according to the method described by Anderson and Siwicki (1994) using hen egg white lysozyme (Sigma) in PBS as a standard. Results were presented as lysozyme units/mL.
MACROPHAGE PHAGOCYTIC ACTIVITY
Head kidneys of five fish per treatment were removed and macrophages were isolated by density gradient centrifugation as follows. After collection, head kidneys were homogenized in supplemented Minimal Essential Medium (MEM) (10 μl/mL heparin; 100 μL/mL penicillin/streptomycin; 2% fetal bovine serum) and filtered through a nylon membrane (100 μm mesh size, Sigma).
Resulting cell solution was layered onto a preformed gradient of 51%-34% Percoll in 10% Hank’s balanced salt solution (HBSS) and centrifuged at 800 × g for 30 min at 4 °C. The interface layer was harvested with a Pasteur pipette, diluted in 1 mL of supplemented MEM and re-centrifuged at 800 × g for 5 min at 4 °C to remove residual Percoll.
The resulting pellet was diluted in 1 mL of supplemented MEM and viability and concentration of macrophage cell suspensions were determined in trypan blue. The final pellet with more than 93% viability was resuspended in supplemented MEM adjusting the final concentration to 106 macrophages/ mL. In Trial 1, macrophage solution was incubated with Vibrio alginolyticus as described by Esteban and Meseguer (1997) for Vibrio anguillarum. In Trial II, macrophage solution was incubated with latex beads (1:100) following the same protocol. Phagocytic activity was measured as described by Blazer (1991). One hundred macrophages per fish were counted and the phagocytic activity was determined as the percentage of macrophages with phagocytic ability.
BACTERIAL ISOLATION AND BIOCHEMICAL CHARACTERIZATION
Samples of head kidney, liver and kidney were cultured on TSA (Tryptone Soybean Agar, Cultimed) and incubated at 25 ºC for 24-48 hrs. All strains isolated were subjected to taxonomic analysis by standard morphological, physiological and biochemical plate and tube tests (Smibert and Krieg, 1981) to identify Vibrio alginolyticus present in the fish.
STATISTICAL ANALYSIS
Means and standard deviations were calculated for each parameter measured. Statistical analyses followed methods outlined by Sokal and Rolf (1995). Data were subjected to a one-way analysis of variance (ANOVA) to analyze the effects of Bio-Mos® inclusion level. When F values showed significance, individual means were compared using Tukey’s test for multiple means comparison. Significant differences were considered at P<0.05.
Results
TRIAL I
No mortalities were recorded during the feeding trial. Results for growth, biometry and feed utilization are shown in Table 2 and Figure 1. After 36 and 67 days of feeding, fish fed diets containing 2 or 4 ppt Bio-Mos® had significantly higher body weight and relative growth. Specific growth rate followed a similar trend (Figure 1).
Total length was also significantly higher in fish fed Bio-Mos®after 36 days of feeding. Feed conversion ratio was not significantly affected by Bio-Mos®, but a positive correlation was found between the total amount of ingested food and the Bio-Mos® inclusion level (y(t36 days) = 88.493x + 2366.6, R2 = 0.9197; y(t67 days) = 321.2x + 5255.2, R2 = 0.869). No significant differences were found in the condition factor (K) (Table 2). Bio-Mos®did not affect whole fish proximate composition (Table 3) or the relative percentages of fatty acids (Table 4).
Morphologic analyses for fish fed diets containing Bio-Mos® revealed qualitatively a regular-shaped morphology of the hepatocytes around sinusoidal spaces and a reduction of the lipid vacuolization of the cytoplasm that decreased the number of hepatocytes with the nuclei displaced to the cellular periphery. This effect was more pronounced in fish fed the higher concentration of Bio-Mos® (Figure 2). Quantitative morphometric analysis of the liver revealed differences (P<0.05) in the cellular parameters studied.
Thus, hepatocytes of fish fed 4 ppt Bio-Mos® presented significantly lower hepatocellular area as well as maximum and minimum cell length (Table 5). No differences in gut histology were found due to diets.
Table 2. Growth performance, nutrient utilization and somatic parameters of European sea bass fed commercial extruded diets containing 0, 2 or 4 ppt Bio-Mos® in Trial I.
abMeans differ, P<0.05.
Table 3. Whole body final proximal composition (g/100 g dry weight) of European sea bass fed commercial extruded diets containing 0, 2 or 4 ppt Bio-Mos® at the end of Trial I (67 days).
abMeans differ, P<0.05
Table 4. Fatty acid composition (g fatty acids/100 g total fatty acids) of European sea bass (whole body) fed commercial extruded diets containing 0, 2 or 4 ppt Bio-Mos® at the end of Trial I (67 days).
abMeans differ, P<0.05
Figure 1. (A) Growth performance (SGR), (B) feed efficiency (FCR) and (C) feed intake for European sea bass fed diets containing 0, 2 or 4 ppt Bio-Mos® (Trial I). (Data are means ± SD; n36 days = 264; n67 days = 210; *Means differ, P<0.05).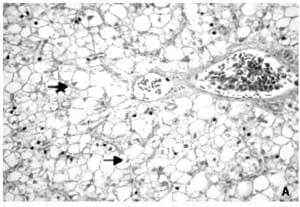
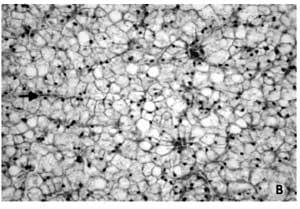
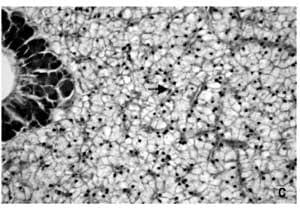
Figure 2. Hepatocytes (H&E x 400) from fish in Trial I fed: (A) Control diet showing foci of swelling hepatocytes characterized by cytoplasm vacuolization and nuclei displaced to cellular periphery, (B) 2 ppt Bio-Mos® diet with lower number of swelling hepatocytes and (C) 4 ppt Bio- Mos® diet with a regular morphology of the hepatocytes located around sinusoidal spaces.
Figure 3. Influence of Bio-Mos® (Trial I) on total (A) phagocytic activity of head kidney macrophages (n=24), (B) reduction potential of circulating neutrophils (n=24), (C) lysozyme activity (n=24), (D) alternative complement pathway activity (n=24) in European sea bass. (mean ± SD; n=24; *Means differ, P<0.05).
Table 5. Results of quantitative image analysis of hepatocytes from European sea bass fed commercial extruded diets containing 0, 2 or 4 ppt Bio-Mos® in Trial I (67 days).
abMeans differ, P<0.05
Phagocytic activity of head kidney macrophages against Vibrio alginolyticus significantly increased (P<0.05) in fish given the highest Bio-Mos® inclusion level (4 ppt) (Figure 3), resulting in a positive correlation between phagocytic activity and the dietary Bio- Mos® inclusion level (y = 4.33x + 19.043, R2 = 0.9742).
No conclusive results were obtained regarding neutrophil potential to reduce NBT, since significant differences were found between all treatments (Figure 3). No significant differences were found in lysozyme and ACH50 values (Figure 3), although a positive correlation was observed between the level of Bio-Mos® inclusion and the level of these parameters in fish serum, (ylysozyme = 22.285x + 389.89, R2 = 0.869), (yACH50 = 7.925x + 89.903, R2 = 0.9074).
TRIAL II
Although all the IP infected fish died within 72 hrs, there were no cohabitation mortalities during the trial. The grade of horizontal transmission was determined by the presence or absence of the pathogen in different internal organs, but the pathogen was only recovered on head kidney. After 21 days of challenge, the number of fish infected by Vibrio alginolyticus was significantly (P<0.05) reduced by dietary Bio-Mos® supplementation (Figure 4). VIE marking allowed the correct identification of all injected fish.
Figure 4. Presence of Vibrio alginolyticus on head kidney of European sea bass fed diets containing different levels of Bio-Mos® and subjected to infection by cohabitation in Trial II (mean ± S.D; n=60; *Means differ, P<0.05).
TRIAL III
No mortalities were recorded during this trial. The grade of pathogen infection was determined by the presence or absence of the pathogen in internal organs and the pathogen was only recovered in head kidney. Ten percent of all pathogen-challenged fish were found to be infected at 24 hrs post-inoculation regardless of the dietary treatment. However, after 48 hrs the number of infected fish in the control treatment was twice that of the Bio-Mos®-treated groups (Figure 5).
Figure 5. Presence of Vibrio alginolyticus presence in head kidney of European sea bass fed diets containing 0, 2 or 4 ppt Bio-Mos® and subjected to infection by anal canalisation in Trial III (mean ± S.D; n=60; *Means differ, P<0.05).
TRIAL IV
No mortalities were recorded during the trial. Results for growth, biometry and feed utilization are shown in Table 6. After 30 and 60 days of feeding, mean body weight, relative growth and SGR were not significantly affected by Bio-Mos® inclusion (Table 6 and Figure 6).
Statistical differences in total length were found between controls and fish given 2 ppt Bio- Mos® at the end of the trial, but no effect was detected on condition factor (K) (Table 6).
After 60 days of the trial, statistical differences were found in FCR between controls and fish given Bio-Mos®, with the exception of the group given 6 ppt Bio-Mos® (Figure 6).
Total amount of feed intake followed a similar trend: after 60 days of dietary Bio-Mos® supplementation statistical differences were found between the control and fish fed 4 and 6 ppt Bio-Mos®. A negative trend was observed between the level of Bio-Mos® inclusion and the total amount of feed ingested (y(t30 days) = -45.497x + 2040.2 , R2 = 0.941; y(t60 days) = -77.212x + 1571.7, R2 = 0.7883) (Figure 6).
Phagocytic activity of head kidney macrophages was evaluated at days 30, 45 and 60 results (Figure 7). The phagocytic activity of fish fed 6 ppt Bio-Mos® was significantly higher than that of the other fish at days 30, 45 and 60, except for the 4 ppt Bio-Mos® group for which there were no differences found at day 60.
The phagocytic activity of fish fed 4 ppt Bio-Mos® was significantly higher than the control group at days 30, 45 and 60, in agreement with the results obtained in Trial I. Analyzing the whole set of data we can observe a positive correlation between the phagocytic activity and the dietary Bio-Mos® inclusion levels at days 30, 45 and 60 (y30 days = 2.6x + 18.833, R2 = 0.8593; y45 days = 3,9667x + 15.778, R2 = 0.9934; y60 days = 2.633x + 18.556, R2 = 0.9473) as seen in Trial I (Figure 8).
Table 6. Growth performance, nutrient utilization and somatic parameters of European sea bass fed commercial extruded diets containing 0, 2, 4 or 6 ppt Bio-Mos®.
abMeans differ, P<0.05
Discussion
In these trials, inclusion of dietary Bio-Mos® at 2 ppt, 4 ppt and 6 ppt did not significantly affect diet proximate composition. However, in Trial I when Bio-Mos® was supplemented in diets of fish at low stocking densities, fish showed significant growth improvement.
Similar responses to Bio-Mos® have been described for broiler chickens (Kumprecht et al., 1997), pigs (Pettigrew, 2000; Miguel et al., 2002), and common carp and rainbow trout (Staykov, 2004). Improved growth may be related to enhanced amino acid absorption as has been shown in chickens (Iji et al., 2001) and as is suggested by improvement in the functional integrity of the enterocyte membrane in Bio-Mos®-fed animals (Spring et al., 2000; Shane, 2001).
In sea bass, dietary Bio-Mos® did not affect fish gut at an optical microscopy level. However, some studies have reported a better microvilli alignment when Bio-Mos® was fed to fish (Dimitroglou and Davies, 2004) or broiler chickens (Iji et al., 2001) where a significant increased jejunal villus height was described. In contrast, when feeding Bio-Mos® at high densities (Trial II) growth improvement was not observed, however this lack of improvement could be related to the higher fish density or increased water temperature compared with Trial I.
In Trial I a positive correlation was also observed for sea bass between dietary Bio-Mos® inclusion level and feed intake, in agreement with the results found in neonatal dairy calves (Heinrichs et al., 2001) and older dogs (Grieshop et al., 2004). Nevertheless, when fish were given dietary Bio-Mos® and stocked at higher densities the opposite effect was observed. A significant reduction in feed intake was detected in Trial II in groups fed 4 or 6 ppt Bio-Mos®, together with a better feed efficiency. Evidence for hormonal involvement in association with fish food intake has been reported. It is believed that the peptide cholecystokinin (CCK) plays an important role in controlling digestive function via pancreatic enzyme secretion together with neural stimulation (Singer, 1993).
CCK is produced in specific cells scattered in the mucosa of the proximal intestine and is secreted into plasma in response to the presence of nutrients in the lumen (Singer, 1993; Cahu et al., 2004). Specific studies in fish have demonstrated that CCK stimulates gall bladder motility (Aldman et al., 1987) and trypsin and chymotrypsin secretion into the gut (Einarsson et al., 1997) and delays gastric emptying in rainbow trout (Olsson et al., 1999). CCK release is regulated by trypsin negative feedback. These observations suggest stimulation of trypsin release may regulate CCK secretion thereby affecting feed intake, but further studies must been done to determine the role that Bio-Mos® plays in feed intake regulation.
Figure 6. (A) Growth performance (SGR), (B) feed efficiency (FCR) and (C) feed intake (g) for European sea bass fed diets containing different levels of Bio-Mos® in Trial IV. (Data are means ± SD; abMeans differ, P<0.05).
Figure 7. Influence of Bio-Mos® on total phagocytic activity of head kidney macrophages in European sea bass in Trial IV at (A) 30 days (B) 45 days (C) 60 days. (mean ± SD; n=24; abMeans differ, P<0.05).
Figure 8. Evolution of Bio-Mos® effect on total phagocytic activity of head kidney macrophages in European sea bass in Trial IV.
Besides the effect on feed intake, glucomannan has also been found to reduce cholesterol absorption in rats by 20% (Gallaher et al., 2000) and increase bile salt excretion (Jie and Shu-Sheng, 1997; Gallaher et al., 1999). In turn, both reduced cholesterol absorption and increased bile salt excretion could reduce liver cholesterol in relation to the reduced liver fat deposition found in sea bass hepatocytes in the present trial. This is in agreement with the results obtained by Young et al. (2000), who reported a significant reduction of fat deposition in liver and a significant hypocholesterolemic effect in liver and eggs after laying hens were fed diets containing 0.1% Bio-Mos®.
Dietary Bio-Mos® incorporation at 4 ppt and 6 ppt significantly improved head kidney macrophage phagocytic activity. There was a positive correlation between the level of dietary Bio-Mos® inclusion and the phagocytic index, evidence of the dose-dependent effect of Bio-Mos® on the phagocytic ability of fish head kidney macrophages.
Comparable results have been obtained for sea bass by Montero et al. (2005), who observed an improvement in immune status and stress resistance in fish fed a mixture of mannan oligosaccharides and ß-glucans for 60 days. A dose-dependent enhancement of phagocytic activity by Bio-Mos® has been also found in chicken macrophages (Lyons, 1994), which could be related to the presence of a mannose receptor involved in microbe recognition and phagocytosis in the absence of specific opsonization (Ofek et al., 1995).
The mannose receptor is the main molecule involved in antigen recognition and the binding process in antigen-producing cells (Engering et al., 1997). Nevertheless, the effect on immune response could be related to other factors. For instance, a selective absorption of tryptophan by gut brush border membrane has been reported in chicks fed Bio-Mos® (Iji et al., 2001) and certain studies show that high doses of tryptophan cause abnormal white blood cell accumulation in tissues (Gross et al., 1996; 1999), evidence of the active role that tryptophan or its metabolites play in modulating immune system activity. Further studies must be conducted to understand the role of Bio-Mos® in fish immunomodulation.
Despite the fact that all of the IP infected fish rapidly died due to the endotoxic shock produced by Vibrio alginolyticus extracellular products (Balebona et al., 1998), no mortality was detected in cohabitants. In other species, such as Chinook salmon, exposure to an Aeromonas salmonicida challenge showed a direct relationship between rapid death of the experimentally infected fish and disease occurrence (Ogut and Reno, 2004).
Hence, the lack of mortality in cohabitant fish seems to be related to a low density of bacteria released to the water from infected fish. However, direct gut inoculation of Vibrio alginolyticus showed a reduction in the number of infected fish by feeding Bio- Mos®.
Among other carbohydrates, mannose constitutes an important surface component of cells. Mannose-specific lectins are utilized by many gastrointestinal pathogens as a means of attachment to the gut epithelium (Mirelman and Ofek, 1986).
These molecules function as adhesins mediating the binding of some bacteria such as Campylobacter jejuni (McSweegan and Walker, 1986) and Aeromonas hydrophila (Merino et al., 1996) to epithelial cells, and mediating the interaction of bacteria with phagocytic cells (Perry and Ofek, 1984; Wright et al., 1989). Some studies have reported that mannose inhibits the in vitro colonization of the chicken small intestine by Salmonella typhimurium (Oyofo et al., 1989) and reduces caecum colonization by S. typhimurium after oral inoculation (Spring et al., 2000).
In summary, these results showed that dietary incorporation of Bio-Mos®, at a rate of least at 4 ppt, enhances sea bass growth at low densities, enhances immune function and increases resistance to bacterial infection directly inoculated in the gut, one of the main sites of infection in fish (Zapata and Cooper, 1990). When fish are stocked at higher densities and fed Bio-Mos® at 4 ppt, FCR is enhanced. More experiments must be conducted to understand the mechanisms of Bio-Mos® response.
Acknowledgements
Special thanks to Graneros de Tenerife, S.A. (Tenerife, Spain) for supplying the extruded diets and to Alevines y Doradas, S.A. (ADSA, Gran Canaria, Spain) for supplying the fish.
References
Anderson, D.P. and A.K. Siwicki. 1994. Simplified assays for measuring non-specific defense mechanisms in fish. Am. Fish Soc. Fish Health Section Spec. Publ., Seattle, WA, USA, pp. 26-35.
Aldman, G. and S. Holmgren. 1987. Control of gallbladder motility in the rainbow trout, Salmo gairdneri. Fish Physiol. Biochem. 4(3):143-155.
AOAC. 1995. Official Methods of Analysis of the Association of Analytical Chemists. Washington, D.C.
Astorga, N., J.M. Afonso, M.J. Zamorano, D. Montero, V. Oliva, H. Fernández and M.S. Izquierdo. 2005. Evaluation of visible implant elastomer tags for tagging juvenile gilthead seabream (Sparus aurata L.): effects on growth, mortality, handling time and tag loss. Aquaculture Res. 36:733.
Balebona, M.C., M.J. Adreu, M.A. Bordas, I. Zorilla, M.A. Moriñigo and J.J. Borrego. 1998. Pathogenicity of Vibrio alginolyticus for cultured Gilt-Head Sea Bream (Sparus aurata L.). Appl. Enviroment. Microbiol. 64(11):4269-4275.
Blazer, V.S. 1991. Piscine macrophage function and nutritional influences: a review. J. Aquat. Anim. Health 3:77-86.
Cahu, C., I. Rønnestad, V. Grangier and J.L. Zambonino Infante. 2004. Expression and activities of pancreatic enzymes in developing sea bass larvae (Dicentrarchus labrax) in relation to intact and hydrolyzed dietary protein: involvement of cholecystokinin. Aquaculture 238(1-4):295-308.
Christie, W.W. 1982. Lipid Analysis. 2nd Rev. Ed., Pergamon Press, Oxford, p. 201. Dimitroglou, A. and S. Davies. 2004. Effects of Bio-Mos® in white sea bream (Diplodus sargus). Alltech’s 2nd Annual Aquaculture Meeting. Dunboyne, Co. Meath, Ireland, November. Oral Communication.
Einarsson, S., P.S. Davies and C. Talbot. 1997. Effect of exogenous cholecystokinin on the discharge of the gallbladder and the secretion of trypsin and chymotrypsin from the pancreas of the Atlantic salmon, Salmo salar L. Comp. Biochem. Physiol. 117C(1):63-67.
Engering, A.J., M. Cella, D. Fluitsma, M. Brockhaus, E.C.M. Hoefsmit, A. Lanzavecchia and J. Pieters. 1997. The mannose receptor functions as a high capacity and broad specificity antigen receptor in human dendritic cells. Eur. J. Immun. 27(9):2417- 2425.
Esteban, M.A. and J. Meseguer. 1997. Factors influencing phagocytic response of macrophages from the sea bass (Dicentrarchus labrax L.): an ultrastructural and quantitative study. Anat. Rec. 248:533-541.
Folch, J., M. Lees and G.H. Sloane-Stanley. 1957. A simple method for the isolation and purification of total lipids from animal tissues. J. Biol. Chem. 226:497-509.
Gallaher, C.M., J. Munion, R. Hesslink, J. Wise and D.D. Gallaher. 1999. Glucomannan and chitosan lower cholesterol by reducing cholesterol absorption. FASEB J. 13:A883.
Gallaher, C.M., J. Munion, R. Hesslink, J. Wise and D.D. Gallaher. 2000. Cholesterol reduction by glucomannan and chitosan is mediated by changes in cholesterol absorption and bile acid and fat excretion. J. Nutr. 130:2753-2759.
Grieshop, C.M., E.A. Flickinger, K.J. Bruce, A.R. Patil, G.L. Czarnecki-Maulden and G.R. Fahey, Jr. 2004. Gastrointestinal and immunological responses of senior dogs to chicory and mannan oligosacharides. Arch. Anim. Nutr. 58(6):483-493.
Gross, B., N. Ronen, A. Reznick, S. Mokady, S. Honigman and E. Livne. 1996. Biochemical and morphological changes observed in rat muscles following consumption of excessive L-tryptophan and atherogenic diets. Adv. Exp. Med. Biol. 398:575-578.
Gross, B., N. Ronen, S. Honigman and E. Livne. 1999. Tryptophan toxicity - time and dose-response in rats. Adv. Exp. Med. Biol. 467:507-516.
Heinrichs, A.J., M.R. Long and T.S. Schriefer. 2001. The response of a non-medicated replacer containing mannan oligosacharide on growth and health parameters in neonatal dairy calves. J. Dairy Sci. 84(Suppl. 1):269.
Iji, P.A., A.A. Saki and D.R. Tivey. 2001. Intestinal structure and function of broiler chickens on diets supplemented with a mannan oligosaccharide. J. Sci. Food Agri. 81:1186-1192.
Izquierdo, M.S., T. Watanabe, T. Takeuchi, T. Arakawa and C. Kitajima. 1990. Optimum EFA levels in Artemia to meet the EFA requirements of red sea bream (Pagrus major). In: The Current Status of Fish Nutrition in Aquaculture (M. Takeda and T. Watanabe, eds). Tokyo Univ. Fisheries, Tokyo, Japan, pp. 221-232.
Izquierdo, M.S. 2005. Essential fatty acid requirements in Mediterranean fish species. Cah. Options Mediterr., pp. 91-102.
Jie, W. and P. Shu-Sheng. 1997. Comparison of hypolipidemic effect of refined Konjac meal with several common dietary fibers and their mechanisms of action. Biomed. Environ. Sci. 10:27-37.
Kumprecht, I., P. Zobac, V. Siske and A.E. Sefton. 1997. Effects of dietary mannan oligosaccharide level on liveweight and feed efficiency of broilers. Poult. Sci. 76(Suppl.1):132.
Lyons, T.P. 1994. A panorama of techniques, processes and products to address animal prodution problems today and tomorrow. In: Biotechnology in the Feed Industry, Proceedings of Alltech’s 10th Annual Symposium (T.P. Lyons and K.A. Jacques, eds). Nottingham University Press, UK, , pp. 1-48.
Martoja, R. and M. Martoja-Pierson. 1970. Técnicas de Histología Animal. Toray- Masson S.A., Barcelona, p. 350.
McSweegan, E. and R.I. Walker. 1986. Identification and characterization of two Campylobacter jejuni adhesins for cellular and mucous substrates. Infect. Immun. 53:141-148.
Merino, S., X. Rubires, A. Aguilar and J.M. Tomas. 1996. The O:34-antigen lipopolysaccharide as an adhesin in Aeromonas hydrophila. FEMS Microbiol. Lett. 139:97-101.
Miguel, J.C., S.L. Rodriguez-Zas and J.E. Pettigrew. 2002. Practical effects of Bio- Mos® in nursery pig diets: a meta-analysis. In: Nutritional Biotechnology in the Feed and Food Industries, Proceedings of Alltech’s 18th Annual Symposium (T.P. Lyons and K.A. Jacques, eds). Nottingham University Press, UK, pp. 425-433.
Mirelman, D. and I. Ofek. 1986. Introduction to microbial lectins and agglutinin. In: Microbial Lectins and Agglutins-Properties and Biological Activity (D. Mirelman, ed). John Wiley & Sons, Inc. New York, NY, USA, p. 1.
Montero, D., A. Fernández-Vaquero, L. Tort, M.J. Caballero and M.S. Izquierdo. 2005. Efecto de inmunoestimulantes en la resistencia a estrés en dorada (Sparus aurata) y lubina (Dicentrarchus labrax). Comunicación oral. X Congreso nacional de Acuicultura, Gandía.
Ofek, I., J. Goldhar, Y. Keisari and N. Sharon. 1995. Nonopsonic phagocytosis of microorganisms. Ann. Rev. Microbiol. 49:239-276.
Ogut, H. and P. Reno. 2004. Prevalence of furunculosis in Chinook salmon depends on density of the host exposed cohabitation. N. Am. J. Aquac. 66:191-197.
Olsson, C., G. Aldman, A. Larsson and S. Holmgren. 1999. Cholecystokinin affects gastric emptying and stomach motility in the rainbow trout Oncorhynchus mykiss. J. Experimen. Biol. 202:160-170.
Oyofo, B.A., J.R. DeLoach, D.E. Corrier, J.O. Norman, R.L. Ziprin and H.H. Mollenhauer. 1989. Prevention of Salmonella typhimurium colonization of broilers with D-mannose. Poult. Sci. 68:1357-1360.
Perry, A. and I. Ofek. 1984. Inhibition of blood clearance and hepatic tissue binding of Escherichia coli by liver lectin-specific sugars and glycoproteins. Infect. Immun. 52:257-262.
Pettigrew, J.E. 2000. Bio-Mos® effects on pig performance: a review. In: Biotechnology in the Feed Industry, Proceedings of Alltech´s 16th Annual Symposium (T.P. Lyons and K.A. Jacques, eds). Nottingham University Press, UK, pp. 31-45.
Shane, S. 2001. Mannan oligosaccharides in poultry nutrition: mechanisms and benefits. In: Biotechnology in the Feed Industry, Proceedings of Alltech’s 17th Annual Symposium (T.P. Lyons and K.A. Jacques, eds). Nottingham University Press, UK, pp. 65-77.
Singer, M. 1993. Neurohormonal control of pancreatic enzyme secretion in animals. In: The Pancreas: Biology, Pathobiology and Disease (V.L.W. Go, E.P. DiMagno, J.D. Gardner, E. Lebenthal, and G.A. Scheele, eds). 2nd edition, Raven Press, New York, NY, USA, pp. 425-448.
Siwicki, A., D.P. Anderson and J. Antychowitz. 1993. Non-specific defence mechanisms assay in fish: I. Phagocytic index, adherence and phagocytic ability of neutrophils (NBT test) and myeloperoxidase activity test. Fish Diseases Diagnosis and Preventions Methods. FAO project GCP/INT/526/JPN 1993:95-103.
Smibert, R.M. and N.R. Krieg. 1981. Systematics: general characterization. In: Manual of Methods for General Bacteriology (P. Herhardt, R.G.E. Murray, R.N. Costilow, E.W. Nester, N.A. Wood, N.R. Krieg and G.B. Phillips, eds). American Society for Microbiology, Washington, DC, pp. 409-443.
Sokal, R.R. and S.J. Rolf. 1995. Biometry. In: The Principles and Practice of Statistics in Biological Research. 3rd ed., Freeman, New York, NY, USA, p. 419.
Spring, P., C. Wenk, K.A. Dawson and K.E. Newman. 2000. The effects of dietary mannan oligosaccharides on cecal parameters and the concentrations of enteric bacteria in the ceca of Salmonella-challenged broiler chicks. Poult. Sci. 79(2):205-211.
Staykov, Y. 2004. The influence of Bio-Mos® on growth rate and immune status of common carp (Cyprinus carpio). In: Alltech’s 2nd Annual Aquaculture meeting. Dunboyne, Co. Meath, Ireland, November, Oral communication.
Verschuere, L., G. Rombaut, P. Sorgeloos and W. Verstraete. 2000. Probiotic bacteria as biological control agents in aquaculture. Microbiol. Mol. Biol. Rev. 64:655-671.
Winton, J.R. 2001. Fish health management, In: Fish Hatchery Management (G. Wedemeyer, eds). 2nd ed., American Fisheries Society, Bethesda, MD, USA, pp. 559- 639.
Wright, S.D., S.M. Levine, M.C.T. Jong, Z. Chad and L.G. Kabbash. 1989. CR3 (CD11b}CD18) expresses one binding site for Arg-Gly-Asp-containing peptides and a second site for bacterial lipopolysaccharide. J. Exp. Med. 169:175-183.
Young, W.P., C. Kim and V.G. Stanley. 2000. Nutritional benefaction and alleviation of aflatoxicosis in chicken meat and eggs by dietary supplementation of mannan oligosaccharide. In: 12th Biennial Research Symposium. ARS, Inc. University of Maryland Eastern Shore, MD, USA.
Zapata, A.G. and E.L. Cooper. 1990. The Immune System: Comparative Histophysiology. John Wiley & Sons Eds, Chichester, England.
Authors: S. TORRECILLAS1, A. MAKOL1, M.J. CABALLERO1, D. MONTERO1, J. SWEETMAN2, L. ROBAINA AND M.S. IZQUIERDO1
1 Canarian Institute of Marine Science & Institute for Animal Health, University of Las Palmas de Gran Canaria, Spain
2 Alltech Aqua, Cephalonia, Greece


.jpg&w=3840&q=75)