Introducción
Quantitative genetic selection, using a weighted index of economically important traits, has been used by commercial breeders for over 60 years to improve the performance of egg-type stocks. That selection has been made primarily on BW, feed conversion (FC), egg number, egg size, various measurements of interior and exterior egg quality, and income over feed and chick cost. The genetic selection applied by commercial breeders has improved the performance of these stocks tremendously, and the performance changes that have been brought about have been documented in numerous summaries over the years of random sample tests, as well as in several independent research studies (Hartmann, 1985; Heil and Hartmann, 1991; Jones et al., 2001; Flock and Heil, 2002; Flock et al., 2003; Wilson et al., 1967). However, because selection for performance improvement continues to take place by current breeding organizations, the strains available to commercial producers continue to change on a yearly basis, and management needs for those stocks also change over time.
Materiales & Métodos
In all of the tests conducted since 1958 eggs have been brought onto the research unit from commercial breeders farms selected in accordance with the operational rules of the NCLP&MT. The eggs were hatched and processed in accordance with current industry practices. Robbins incubators were used through 1997, when we purchased Nature Form Incubators and Hatchers.
Pullet Housing and Husbandry
1st through 5th NCRST
The pullets in the first 5 RST were housed in a litter pens at a population of 60 pullets per pen which had 175 sq ft for a bird density of 2.92 sq ft per bird. The pullets were not beak trimmed. The vaccination program included a Newcastle Bronchitis@ 1d; Coccid @ 5d and 10 wk; Newcastle Dust 34 d; Fowl Pox @ 84 d; Newcastle-Bronchitis Dust 114 d (Martin, 1959, 1960, 1961, 1962, 1963).
6th through 12th NCRST
Pullets were grown on dirt later the floors were concrete covered with litter. Slats were added for the 8th RST such that the pens were composed of 63% slat:37% litter. At the same time the floor space was reduced to 1.5 sq ft/pullet and was further reduced to 1.4 sq ft in the 12th RST. Vaccination programs were expanded in the 6th RST to include Avian encephalomylitis@ 129 d. The emergence of Marek´s disease in the 11th RST resulted in a significant mortality. The 12th RST saw the inclusion of cages into the rearing program. Cages (24"x 22") were constructed and chicks were brooded at 17.6 sq in/chick to 2 wks; 26.4 sq in/chick t 5 wks; then 61.6 sq in/pullet through to layer housing.
13th through 19th NCRST
Slat/Litter pens continued as a portion of the rearing program with a density of 1.4 sq ft/bird until the 19th RST when the density was reduced to 1.37 sq ft/bird. A light controlled facility was added and the rearing cage densities during the brooding period were 24 sq in through 5 wks then the cage populations were split and the final density through 20 weeks was 56 sq in. in the curtain sided facility and 23 sq in through 5 weeks followed by 69 sq in until 20 wks. Marek´s vaccine administered at hatch was begun.
20th NCRST through the 25th NCLP&MT
Beginning with the 20th RST pullet rearing went entirely to cages with the rearing densities during the brooding period were 24 sq in through 5 wks then the cage populations were split and the final density through 20 weeks was 56 sq in. in the curtain sided facility and 21 sq in through 5 weeks followed by 64 sq in until 20 wks.
26th through the 28th NCLP&MT
All laying stocks were reared in replicates randomly placed throughout the rearing facility (intermingled). Pullet density for both white and brown egg strains were reared using identical programs. The step-down step-up lighting program in the rearing phase became standard such that the pullets reached 15 hr of light just prior to the transfer to the laying house and before 1% production.
29th throught 37th NCLP&MT.
Beginning with the 29th NCLP&MT a hatch report was provided. A standardized 3-phase rearing dietary regimen was in place and maintained isocaloric at approximately 2900 Kcal/kg consisting of a Starter with 20% CP, Grower with 18% CP, and a Developer with 16% CP. Pullets were placed on a Pre-Lay diet with 22% CP and 4.5% Ca at approximately 15 wks of age.
37th NCLP&MT and Currently
In the 37th NCLP&MT a floor/range rearing scenario was conducted on a trial basis. This program was continued into the 38th NCLP&MT and will continue on into the forseable future for both the range production aspect of the test and the inclusion of the cage-free production system.
Layer Housing and Husbandry
1st through 7th NCRST
Hens were housed in on pens with concret floors with the litter on top and a layer density of 3.5 sq ft/bird. A single ration was used for the entire production period which was 16% CP and 840 Kcal/lb in winter and 82Kcal/lb in summer months.
8th through 11th NCRST
Three laying house environments were established 50% slat and 50% litter pens with the hens housed at 1.5 sq ft/bird, all slat with hens housed at 1 sq ft/bird, and 2 bird cages (90 sq in/bird). This was consistent for these 4 tests.
12th NCRST through the 18th NCRST
Three laying house environments were established 50% slat and 50% litter pens with the hens housed at 1.7 sq ft/bird, 2 bird cages (90 sq in/bird), and 7 bird cages (69 sq in/bird). These environments were the same through the 18th RST. In the 15th RST 10 strains were entered into the test which was down from 20. In the 17th RST the hens in the 7 bird cages had been toe trimmed during the rearing period, this was the only test in which toe trimming was used.
19th NCRST through the 25th NCLP&MT
During this period there were a number of gradual environmental changes that began with the 19th RST when the first light and ventilation control facility with 3 bird cages (72 sq in/bird) was added, while the slat/litter and 2 hen cages remained in curtain houses. In addition, a step up lighting program which culminated in 17L:7D light cycle. In the 20th RST the slat/litter house was eliminated, 2 densities were used in the cages of 56 and 64 sq in/hen. Hens were fed using a phase feeding program to breeder recommendations. Three house types were included in the 22nd RST: the light and ventilation controlled facility, high rise curtain sided house, and flush pit curtain sided house. Each of these houses was equipped with a combined system which included shallow and deep cages and also examined hen populations of 3 and 4 hens/cage.
26th through 37th NCLP&MT
This series of tests introduced the use of molt programs with the use of the fasting program and in the 34th with the emergence and acceptance of the non-anorexic program. Throughout the 26th to the 37th NCLP&MT there were minor housing changes with the primary production facilities being the high rise and flush pit house. Both houses were equipped with cages which were 16 in deep and varied in width from 12 to 32 in with densities ranging from 48 to 84 sq in. The density and hen population studies were conducted throughout this period which saw an increase in hen populations to as high as 8 hens/cage. In 1997 both production houses were remodeled with new cages (16 x 24 and 16 x 32 in) and the flush pit house was converted to light tight force ventilated scraper pit house. The step up lighting program was consistent with a step-up program which maximized the day length at 16L:8D in the first cycle and 16.5L:7.5D in the second cycle. The lighting program was altered beginning with the 36th test to delay the onset of age at 50% production by moving the pullets into the laying facilities at 10L:14D than gradually increasing the day length to 16 hrs from 17 to 31 wks.
Statistical Analysis
The rearing report data were subjected to PROC REG procedure of SAS (1996) with main effect being the test. Separate analyses were conducted for white and brown egg strains. The regression line was broken into 3 segments or 2 change points which indicated tests where significant husbandry or housing changes were made. SAS statements were developed for 2 change points through out the history of the rearing reports. The significant ones for determining the change points in the analysis are as follows:
- Tests 1-18 Pullets reared on litter flooring
- Tests 19-25 Comparison of pullet rearing house environments
- Litter/slats
- Slats
- Cages (density)
- Tests 26-37 All cage rearing at a constant density comparing open and closed housing.
The overall changes in growth characteristics due to genetic selection were compared using the T Test procedure. Comparing the white and brown egg strains represented within the first and thirty-seventh NCLP&MTs.
The laying period report data were subjected to PROC REG procedure of SAS (1996) with main effect being the test. Separate analyses were conducted for white and brown egg strains. The regression line was broken into 4 segments or 3 change points which indicated tests where significant husbandry or housing changes were made. SAS statements were developed for 3 change points through out the history of the layer reports. The following conditions in the management of the tests pinpointed the 4 segments or 3 change points during the history of the NC RST and NCLP&MT which were used in the analysis of the production data.
- Tests 1-7 Litter flooring
- Tests 8-18 Comparison of laying house environments
- Litter/slats
- Slats
- Cages
- Tests 19-25 All cage production comparing populations and densities
- Tests 26-37 Molting programs were introduced with extended production cycles from 105-110 wks. Continued with hen population and density studies.
The overall changes in production characteristics due to genetic selection were compared using the T Test procedure. Comparing the white and brown egg strains represented within the first and thirty-seventh NCLP&MTs.
The data for the 2nd cycle began with the 26th test when molting became a standard husbandry practice. The 2nd cycle laying period report data were subjected to PROC REG procedure of SAS (1996) with main effect being the test. Separate analyses were conducted for white and brown egg strains. The 3 regression lines were developed due to the overlap of procedures where significant molt procedures were made such as the transition to the non-anorexic molt program from the fasting method and the maintenance of a non-molted group. The overall changes in production characteristics due to genetic selection were compared using the T Test procedure. Comparing the white and brown egg strains represented within the twenty-sixth and thirty-seventh NCLP&MTs.
"Test" equates to the flock number (1st RST through 37th NCLP&MT) in chronological order.
Resultados & Discusión
Pullet performance
However, there have been subtle changes which may have also influenced the changes in body weights and feed consumption. The greatest of these are the duration of the rearing period or in other terms the age of the pullet when the rearing phase was determined to be complete. In the early RST 1-18 the rearing period was 20 wks, RST 19-25 the rearing period was approximately 18 wks, and in the NCLP&MT 26-37 initially it was 18 wks then from the 31st through the 37 it was approximately 16 wks.
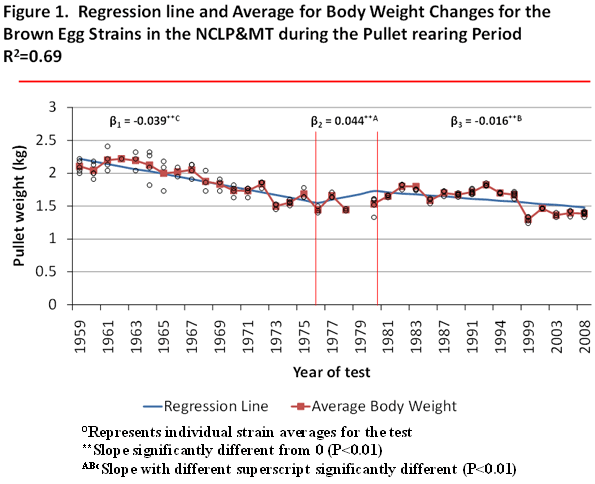
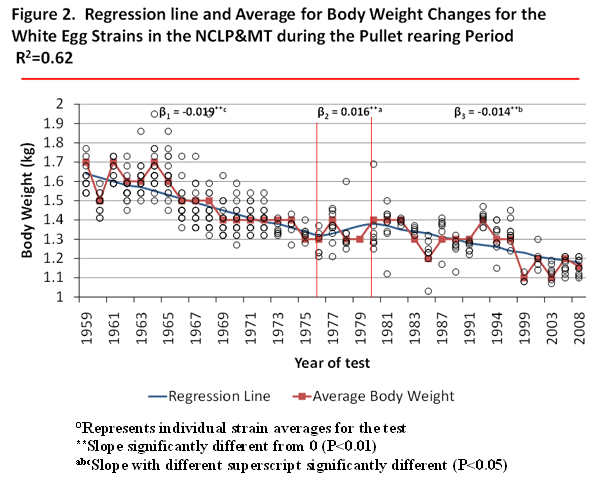
The pullet body weights for both brown and white egg strains decreased by 0.72 and 0.45 kg, respectively over 53 yrs. In this same time period the brown egg strains decreased feed intake by 5.01 kg/pullet and by 3.42 kg/pullet in white egg hens (Tables 1 and 2). Surprisingly, only the rearing period mortality declined in only the brown egg strains while the white egg strains remained similar throughout the history of the tests (Figures 1 and 2).
Table 1: Impact of genetic selection on pullet growing characteristics in brown egg strains
abMedias con distinta letra difieren significativamente (p<0.05).
ABMedias con distinta letra difieren significativamente (p<0.0001).
Table 2: Impact of genetic selection on pullet growing characteristics in white egg strains
ABMedias con distinta letra difieren significativamente (p<0.0001).
Layer Performance Single Cycle
The age at 50% production increased for the brown egg hens during the first two segments then began a steady reduction in age to approximately 139 d at 50% production with a similar reduction in white egg layers however, the pattern of change was relatively constant through the first 2 segments at 171 d at 50% production then in the last two segments the age steadily declined to 139 d (Tables 3 and 5). In both groups the age at 50% increased in the last 2 tests due to a lighting program which delayed sexual maturity. From 1958-1965 HD production declined slightly then after that point increased steadily through 2009. Hen-Housed Production appeared to change at each change point throughout the history of the test for both brown and white egg layers.
Table 3: Impact of genetic selection on production characteristics in white egg strains
ABMedias con distinta letra difieren significativamente (p<0.0001).
Table 4: Impact of genetic selection on mortality,egg wt, and size distribution in white egg strains
abMedias con distinta letra difieren significativamente (p<0.05).
ABMedias con distinta letra difieren significativamente (p<0.0001).
In general terms the feed consumption/100 hens has decreased slightly throughout the tests for both the brown and white egg layers however the conversion of that feed into eggs has steadily improved to the point it is today where the hens produce 0.5 kg of egg/1 kg of feed.
Mortality in brown egg layers has decreased from about 17% in 1958 to 6% in 2009. However, the white egg layer mortality increased significantly to 1965 then steadily declined through 2009. This could be attributed to the use of Marek´s vaccines after that point.
Table 5: Impact of genetic selection on production characteristics in brown egg strains
ABMedias con distinta letra difieren significativamente (p<0.0001).
Table 6: Impact of genetic selection on mortality,egg wt, and size distribution in brown egg strains
abMedias con distinta letra difieren significativamente (p<0.05).
ABMedias con distinta letra difieren significativamente (p<0.0001).
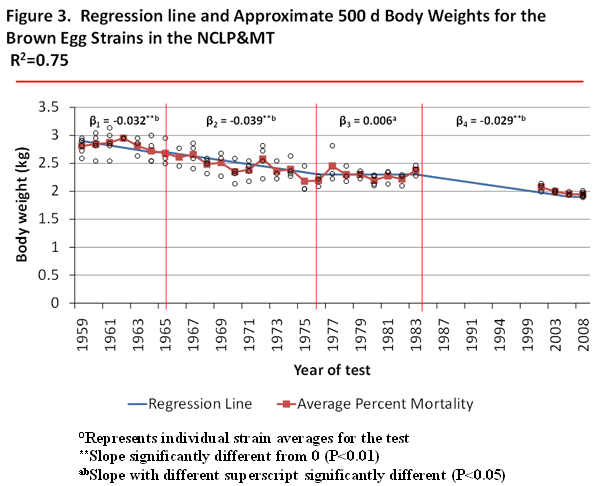
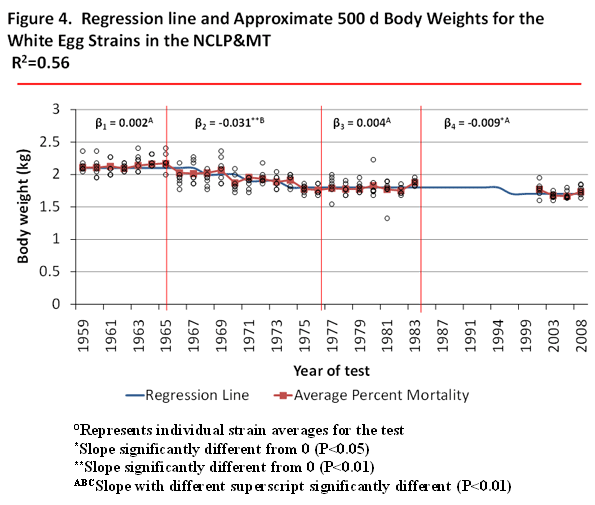
The 500 day body weights have decreased for both brown and white egg layers from 1958 through 2009. The BW of the browns decreased by 1kg and in white egg strains by 0.4 kg.
Interestingly there appears to be a significant influence of management on the improvements in growth and production. This is illustrated by the changing slopes of the regression analysis lines as the flocks progressed through the 2 change points in the rearing reports and the 3 change points in the egg production reports. It would be interesting to differentiate the influence of management and genetic selection on the improved performance characteristics.
Layer performance 2nd Cycle
The post-molt performance of the white and brown egg strains has steadily improved since the inception of the molting process by 8.2 and 9%,
respectively. Interestingly, the number of eggs produced in the 2nd cycle was not significantly improved in the white egg strains but was improved by 12 eggs/hen in the brown egg strains. Feed consumption per 100/d increased from the 26th to the 37th test. However, the greatest difference was in the feed conversion to eggs in both the white and brown egg strains of 0.08 kg and 0.112 kg/kg feed, respectively.
Table 7: Impact of genetic selection on production characteristics in white egg strains post-molt
abMedias con distinta letra difieren significativamente (p<0.05).
ABMedias con distinta letra difieren significativamente (p<0.0001).
Table 8: Impact of genetic selection on mortality,egg wt, and size distribution in white egg strains post-molt
abMedias con distinta letra difieren significativamente (p<0.05).
ABMedias con distinta letra difieren significativamente (p<0.0001).
Table 9: Impact of genetic selection on production characteristics in brown egg strains post-molt
ABMedias con distinta letra difieren significativamente (p<0.0001).
Table 10: Impact of genetic selection on mortality, egg wt, and size distribution in brown egg strains post-molt
abMedias con distinta letra difieren significativamente (p<0.05).
ABMedias con distinta letra difieren significativamente (p<0.0001).
Conclusiones
Monitoring of the growth and production characteristics of the commercial egg strains is vital to ensure that optimal performance can be achieved. These criteria have been used as the standard performance criteria for 53 years of the NCLP&MT. As shown in the figures the husbandry practices used with the flocks can overwhelm the genetics of the hens in negative ways or can enhance their performance.
Bibliografía
- Anderson, K. E., 2002. Final Report of the Thirty Fourth North Carolina Layer Performance and Management Test. Vol. 34, No.4 North Carolina Cooperative Extension Service, November 2002. Website: http://www.ces.ncsu.edu/depts/ poulsci/tech_manuals/layer_performance_tests.html#layer_34.
- Anderson, K. E., 2009. Final Report on 37th North Carolina Layer Performance and Management Test. Vol. 37, No. 5, October 2009. North Carolina Cooperative Extension Service, North Carolina State University and North Carolina Department of Agriculture, Raleigh, NC.
- Bell, D. D., 2003. Historical and current molting practices in the U.S. table egg industry. Poult. Sci. 82:965-970.
- Flock, D. K., and G. Heil. 2002. A long-term analysis of time trends in the performance profile of white-egg and brown-egg hybrid laying strains based on results of official German random sample tests from 1974/75 to 1997/99. Archiv. Fur Geflugelkunde 41:153-159.
- Flock, D. K., G. Heil, and K. Damme. 2003. Whither random sample testing for laying hens in Europe? Proc. 3rd Eur. Poult. Genetics Symp, Wageningen, NL, p. 27-36.
- Hartmann, W. 1985. Random sample poultry tests - their development and present status in European countries. World´s Poult. Sci. J. 41:153-159
- Heil, G., and W. Hartmann. 1991. Combined summaries of European random sample tests completed in 1997 and 1998. World´s Poult. Sci. J. 55: 203-205.
- Jones, D. R., K. E. Anderson, and G. S. Davis. 2001. The effects of genetic selection on production parameters of single comb White Leghorn hens. Poult. Sci. 80:1139-1143.
- Martin, G. A., 1959. North Carolina Random Sample Egg Laying Test: First year-Growing Report. Vol. 1, No. 1. North Carolina Department of Agriculture and North Carolina State College, School of Agriculture, Raleigh, NC.
- Martin, G. A., 1960. North Carolina Random Sample Egg Laying Test: Second year-Growing Report. Vol. 2, No. 1. North Carolina Department of Agriculture and North Carolina State College, School of Agriculture, Raleigh, NC.
- Martin, G. A., 1961. North Carolina Random Sample Egg Laying Test: Third year-Growing Report. Vol. 3, No. 1. North Carolina Department of Agriculture and North Carolina State College, School of Agriculture, Raleigh, NC.
- Martin, G. A., 1962. North Carolina Random Sample Egg Laying Test: Fourth year-Growing Report. Vol. 4, No. 1. North Carolina Department of Agriculture and North Carolina State College, School of Agriculture, Raleigh, NC.
- Martin, G. A., 1963. North Carolina Random Sample Egg Laying Test: Fifth year-Growing Report. Vol. 5, No. 1. North Carolina Department of Agriculture and North Carolina State College, School of Agriculture, Raleigh, NC.
- Martin, G. A., 1960. Final summary report: First North Carolina Random Sample Test. Vol. 1, No.2, North Carolina Agricultural Extension Service, Raleigh, NC 27695.
- Martin, G. A., 1984a. Final summary report: Twenty Fourth North Carolina Layer Production and Management Test. Vol. 24, No.4, North Carolina Agricultural Extension Service, Raleigh, NC 27695, January 6.
- Martin, G. A., 1984b. Final summary report: Twenty Fifth North Carolina Layer Production and Management Test. Vol. 25, No.4, North Carolina Agricultural Extension Service, Raleigh, NC 27695, October 17.
- Mustian, D., G. Martin, J. Carey, D. Harwood, R. Cook, and G. Benson, 1988. Impact Study Agriculture and Natural Resources: Animal and Poultry Performance Testing Programs, Random Sample Layer Test. North Carolina Agricultural Extension Service, Raleigh, NC 27695.
- United Egg Producers. 2005. United Egg Producers Animal Husbandry Guidelines for U. S. Laying Flocks., 2nd Edition. U.E. P., 1720 Windward Concourse, Suite 230, Alpharetta, GA 30005
- USDA. 1979. 1978 Report of Random Sample Egg Production Tests, United States and Canada"
- Wilson, H. R., J. E. Jones, and R. W. Dorminey. 1967. Performance of layers under various cage regimens. Poult. Sci. 46:422-425.


.jpg&w=3840&q=75)