1. Introduction
At times, sorghum provides, either partially or entirely, the feed grain base in Australian pig and poultry diets but it has been associated with sub-optimal or inconsistent growth performance in broiler chickens (Selle et al., 2010a; Liu et al., 2015a). A beneficial characteristic for including sorghum in broiler diets is as a source of energy, which is mainly derived from starch. However, energy utilisation in sorghum-based diets is considered to be inferior to wheat and maize under Australian conditions (Black et al., 2005). Liu et al. (2015a) nominated three factors inherent in sorghum which may be largely responsible for the relatively inefficient utilisation of dietary energy. The three factors were (i) kafirin, the dominant protein fraction in grain sorghum; (ii) phenolic compounds, potentially including condensed tannin and (iii) phytate or myo-inositol hexaphosphate (IP6). In order to clarify the underlying reasons for the inconsistent growth performance and nutrient utilisation in broiler chickens offered sorghum-based diets, the present study embraces ‘equilateral triangle response surface design’ (Raubenheimer, 2011; Liu et al., 2015b). Such designs generate response surfaces which graphically depict interactions between feedstuffs, in this case grain sorghum. The total amount of the mixture must be held constant so that responses are entirely dependent on the relative proportions of feedstuffs in the blend. In the present study, three diverse sorghum varieties were extensively characterised and incorporated into ten nutritionally-equivalent diets at 620 g/kg. The diets contained different concentrations of kafirin, phytate and phenolic compounds by mixing the three sorghums at different inclusion rates. ‘Contour plot’ response surfaces were then used to interpret variations in broiler performance. The intention of the present study was to examine how three different sorghums, with divergent nutritional characteristics, influence growth performance and nutrient utilisation by using equilateral triangle mixture design.
2. Materials and methods
2.1. Characteristic of sorghums
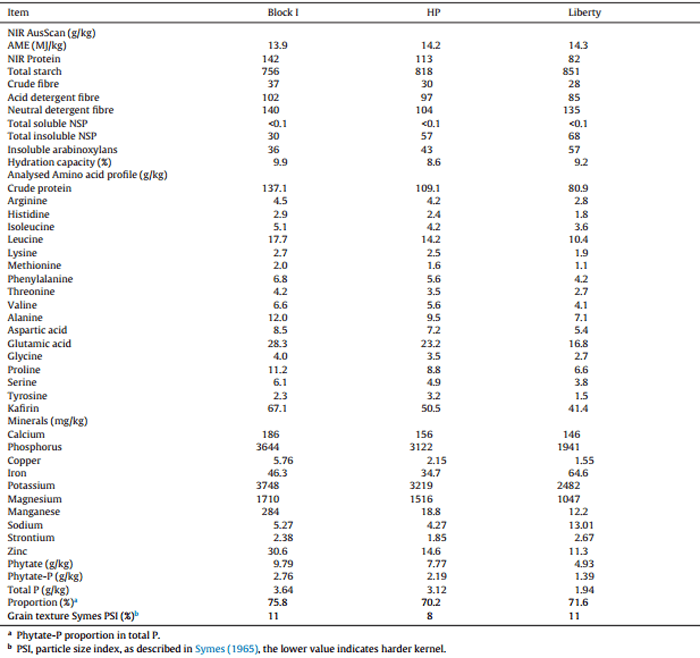
Two red (HP and Block I) and one white (Liberty) grain sorghum varieties were evaluated in this study. “Block I” was grown in the Murrumbidgee Irrigation Area (NSW, Australia) in 2012, “HP” on the Liverpool Plains (NSW, Australia) in 2013 and the white variety, Liberty, was grown on the Darling Downs (Qld. Australia) and harvested in 2014. These three sorghums were extensively characterised which included concentrations of protein, amino acids, kafirin, minerals, phytate, NIR AusScan results and grain texture (Symes, 1965) as shown in Table 1. Concentrations of protein and fourteen amino acids except cysteine and tryptophan, were determined in duplicates as outlined by Cohen and Michaud (1993). Kafirin was quantified by a method adapted from Wallace et al. (1990) and Hamaker et al. (1995). Ground sorghum (100 mg) was incubated with 1 mL total protein extraction buffer (12.5 mM sodium borate, pH 10.0, 1% SDS, 2% 2-mercaptoethanol)for 1 h with agitation at room temperature. Each sample was centrifuged for 15 min at 14,000 rpm at room temperature. Total protein was extracted twice more as above and the supernatants pooled. To isolate kafirin from the total protein extract, 100% t-butanol was added to the pooled supernatant at a final concentration of 60%, and incubated for 30 min at room temperature with occasional mixing. The extract was then centrifuged for 15 min at 9500 rpm at room temperature, which resulted in the formation of a pellet (non-kafirin) and supernatant (alcohol- soluble kafirin). Kafirin was extracted from each sorghum sample in duplicate.
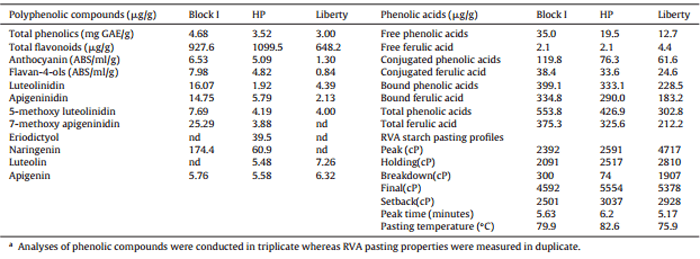
The concentrations of nine minerals in the diets and excreta were analysed by Inductively Coupled Plasma-Optical Emission Spectroscopy using a Perkin Elmer OPTIMA 7300 (Perkin Elmer Inc., Waltham, MA). Phytate was determined by an HPLC procedure (Skoglund et al., 1997a,b). Additionally, as per Table 2, concentrations of total phenolic compounds, polyphenols, free, conjugated, and bound ferulic acid and total phenolic acids plus RVA starch pasting profiles in the three sorghums were determined. The rapid visco-analysis (RVA) starch pasting profiles were determined using a Rapid-Visco-Analyzer. Within 13 min intervals, a 28 g mixture of sorghum or diet and water (15:85 w/w) were prepared and held at 50 °C temperature for 1 min and then heated from 50 °C to 95 °C. After holding the hot paste at 95 °C for 2.5 min, the slurry was again cooled to 50 °C, and then held at that temperature for 2 min. The analytical procedures for quantification of phenolic compounds were previously outlined in detail in Khoddami et al. (2015).
2.1.1. Diet preparation
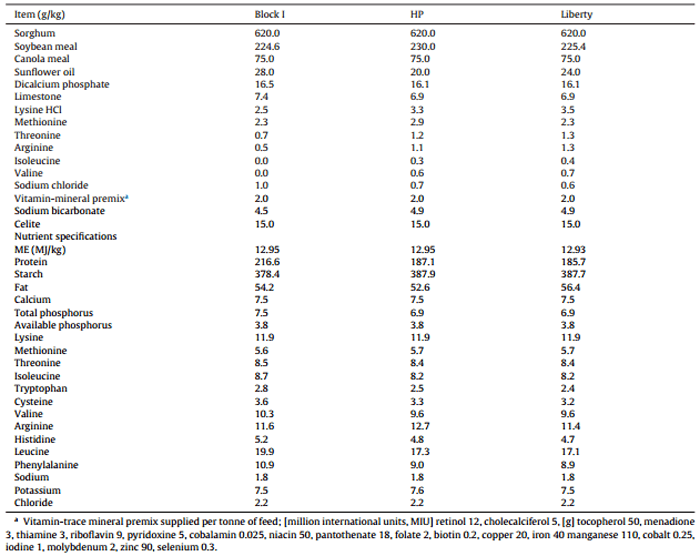
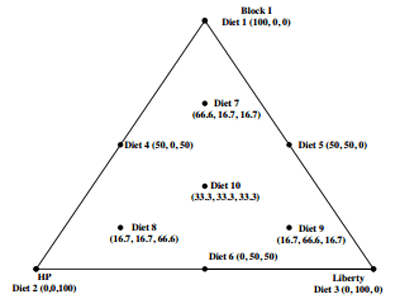
Three diets containing 620 g/kg Block I, HP or Liberty varieties were formulated with an energy density of 12.94 MJ/kg and similar amino acid profiles. Their dietary composition and calculated nutrient specifications of the three basal diets are tabulated in Table 3. The equilateral triangle trial design for ten broiler diets based on blends of three basal diets are shown in Fig. 1. The sorghum grains were ground through a 3.2 mm hammer-mill screen prior to their dietary incorporation. Diet 1, 2 and 3 were mixed individually and then remixed to form the remaining experimental diets according to the percentages as described in Fig. 1. The diets were pelleted through a Palmer PP330 pellet press (Palmer Milling Engineering, Griffith, NSW, Australia) at a conditioning temperature of 84 °C by the automatically controlled introduction of steam into the conditioner with a residence time of 14 s. The conditioning temperature was recorded by thermal probes at the exit of the conditioner before the diet entered the pellet press with die dimensions of 4 mm in diameter. Finally, the diets were cooled in a vertical cooler to room temperature and then crumbled.
2.2. Bird management
Feather-sexed, male broiler chicks (Ross 308) were housed in an environmentally-controlled facility and were initially offered a proprietary starter ration. Birds had unlimited access to feed and water under a “23 h on–1 h off” lighting regimen for the firstthree days and then under a “16 h on–8 h off” lighting regimen for the rest ofthe study. The birds were individually identified (wing-bands) and weighed at day 7 and distributed amongst cages so that mean body weights in each cage and their variations were nearly identical. The ten dietary treatments were offered to six replicates (six birds per replicate cage) from 7 to 28 days post-hatch. Body weights were determined on days 7 and 28 and feed intakes were recorded over the entire period to calculate feed conversion ratios (FCR) with adjustments made from the weight of any dead or culled birds, which were monitored on a daily basis.
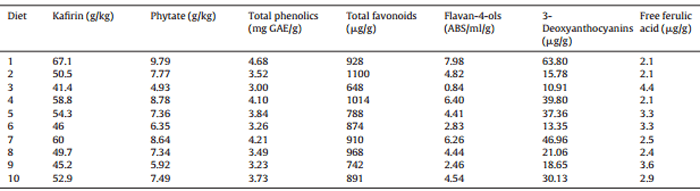
Table 1 NIR AusScan results, concentrations (as-is) of protein, amino acids, kafirin, minerals and phytate, grain texture of Block I, HP and Liberty sorghum varieties
2.3. Sample collection and chemical analysis
Total excreta were collected from 24 to 26 days post-hatch from each cage to determine parameters of nutrient utilisation which included apparent metabolisable energy (AME), metabolisable energy to gross energy ratios (AME:GE), nitrogen (N) retention and N-corrected apparent metabolisable energy (AMEn). Excreta were dried in a forced-air oven at 80 ?C for 24 h and the gross energy (GE) of excreta and diets were determined using an adiabatic bomb calorimeter. The AME values of the diets were calculated on a dry matter basis from the following equation:
Table 2 Concentrations of total phenolic compounds, polyphenols, free, conjugated, bound and total phenolic acids and ferulic acid and RVA starch pasting profiles of Block I, HP and Liberty sorghum varietiesa.
Table 3 Dietary composition and calculated nutrient specifications of sorghum-based diets based on Block I, HP and Liberty varieties.
Fig. 1. Dietary treatments in an equilateral triangle design broiler bioassay.
AME:GE Ratios were calculated by dividing AME by the GE of the appropriate diets. N contents of diets and excreta were determined using a nitrogen determinator (Leco Corporation, St Joseph, MI) and N retentions calculated from the following equation:
N-correctedAME (AMEn MJ/kg DM) values were calculatedby correctingNretentionto zerousing the factor of36.54 kJ/g N retained in the body (Hill and Anderson, 1958).
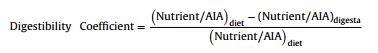
The jejunum is reported to be the major site of glucose and amino acid absorption but the extent of nutrient digestion at the end of ileum is usually reported in the literature (Riesenfeld et al., 1980; Liu and Selle, 2015). Apparent digestibility coefficients of starch and protein were determined in both distal jejunum and distal ileum in the present study. On day 28, the birds were euthanised by intravenous injection of sodium pentobarbitone and digesta samples were collected in their entirety from the two segments of small intestine (distal jejunum and distal ileum) to determine nutrient (starch and protein) digestibility coefficients and nutrient disappearance rates (g/bird/day). Acid insoluble ash (Celite®) was included in diets at 15 g/kg as an inert marker to determine starch and N digestibility. The small intestines were removed from euthanised birds and samples of digesta were gently expressed from the distal jejunum and distal ileum in their entirety and pooled for each cage. Distal jejunal samples were taken from below the mid-point between the duodenal loop and Meckel’s diverticulum. Distal ileal samples were taken from below the mid-point between Meckel’s diverticulum and the ileo-caecal junction. The digesta samples were freeze-dried to determine apparent digestibilities of starch and crude protein (N) using acid insoluble ash (AIA) as the inert dietary marker. About 0.65-0.85 g of dried digesta samples were used for quantifying AIA. Starch concentrations in diets and digesta were determined by a procedure based on dimethyl sulphoxide, -amylase and amyloglucosidase as described by Mahasukhonthachat et al. (2010). N concentrations were determined as already stated and AIA concentrations were determined by the method of Siriwan et al. (1993). The apparent digestibility coefficients for starch and protein (N) in two small intestinal sites were calculated from the following equation:
Starch and protein (N) disappearance rates (g/bird/day) were deduced from the following equation:
Nutrient disappearance rate(g/bird/day) =
feed intake(g/bird) × dietary nutrient(g/kg) × nutrient digestibility(apparent digestibility coefficient)
Ratios of starch to protein disappearance rates in the intestinal segments were calculated as this effectively cancels the potentially confounding influence of feed intake.
Experimental data were analysed using JMP® 9.0.0 (SAS Institute Inc. JMP Software. Cary, NC) and response surfaces were generated with R 3.0.3 software. The experimental units were replicate cage means and statistical procedures included univariate analyses of variance using the general linear models procedure, Pearson correlations and single and multiple linear regressions. A probability level of less than 5% was considered to be statistically significant. In model prediction, the non-significant coefficients were excluded which resulted in recalculation of their reduced equations for each response. When more than one models were significant, Akaike Information Criterion was used for model comparison and selection. Additionally, the response surface plots were constructed so that the effects from changing factor levels on the examined responses can be visualized. The feeding studies complied with specific guidelines approved by the Animal Ethics Committee of The University of Sydney.
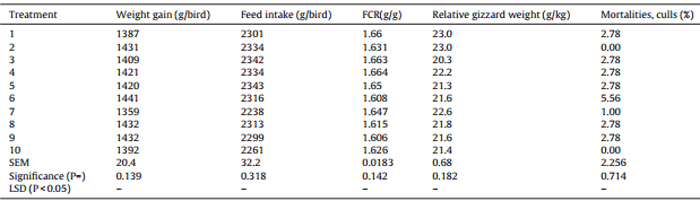
Table 4 Effects of ten sorghum-based dietary treatments on growth performance, relative gizzard weights and mortality/cull rates of broiler chickens from 7 to 28 days post-hatch.
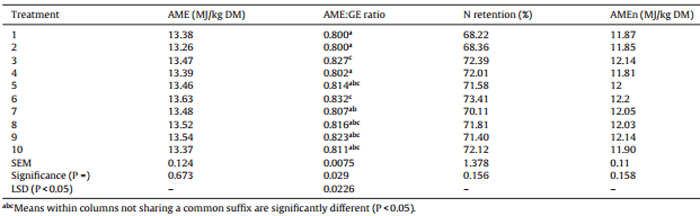
Table 5 Effects of ten sorghum-based dietary treatments on nutrient utilisation of broiler chickens from 7 to 28 days post-hatch.
3. Results
The outcomes for growth performance, relative gizzard weights and mortality/cull rates are shown in Table 4, where there were no significant differences between the ten dietary treatments. Overall, the average weight gain was 1412 g/bird (range 1387–1441), average feed intake was 2308 g/bird (range 2238–2343) and the mean FCR was 1.634 (range 1.606–1.663). The average weight gain and feed intake was higher than 2014 Ross 308 performance objectives. The average relative gizzard weight was 21.9 g/kg and the overall 2.32% mortality rate was not related to treatment.
The nutrient utilisation results are shown in Table 5. There were significant differences (P < 0.03) in AME:GE ratios, which indicate the efficiency of energy utilisation between dietary treatments. The mean AME:GE ratio was 0.813, which ranged from 0.800 in treatments 1 (Block I) and 2 (HP) to 0.832 in treatment 6 (equal blend of HP and Liberty). There were no significant differences between treatments for AME, N retention and AMEn.
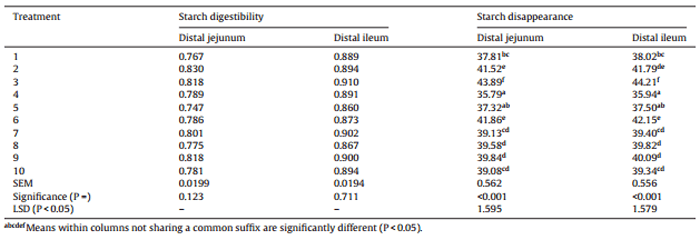
The effects of dietary treatments on starch digestibility coefficients and starch disappearance rates in the distal jejunum and distal ileum are shown in Table 6. Starch digestibility coefficients were not significantly different with a mean value of 0.791 (range: 0.747–0.830) in the distal jejunum and 0.888 (range: 0.867–0.910) in the distal ileum. There were, however, significant differences (P < 0.001) in starch disappearance rates at both sites. In the distal jejunum, starch disappearance rates ranged from 35.79 g/bird/day in treatment 4 (equal blend of HP and Block I) to 41.86 g/bird/day in treatment 6 (equal blend of HP and Liberty). In the distal ileum, starch disappearance rates ranged 35.94 g/bird/day in treatment 4 (equal blend of HP and Block I) to 44.21 g/bird/day in treatment 3 (Liberty).
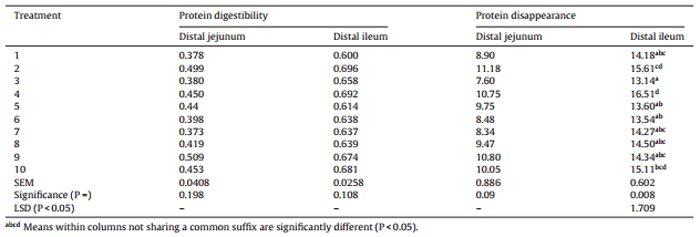
The effects of dietary treatments on protein (N) digestibility coefficients and protein (N) disappearance rates in the distal jejunum and distal ileum are shown in Table 7. Protein digestibility coefficients were not significantly different with a mean value of 0.430 (range 0.378–0.509) in the distal jejunum and 0.653 (range 0.600–0.696) in the distal ileum. Protein disappearance rates were not significantly different in the distal jejunum with a mean value of 9.53 g/bird/day (range 7.60–11.18). However, there were significant differences (P < 0.01) in protein disappearance rates at the distal ileum which ranged from 13.14 g/bird/day in treatment 3 (Liberty), to 16.51 g/bird/day in treatment 4 (equal blend of HP and Block I).
Table 6 Effects of ten sorghum-based dietary treatments on starch digestibility coefficients and starch disappearance rates (g/bird/day) in the distal jejunum and distal ileum at 28 days post-hatch.
Table 7 Effects of ten sorghum-based dietary treatments on protein (N) digestibility coefficients and protein (N) disappearance rates (g/bird/day) in the distal jejunum and distal ileum at 28 days post-hatch.
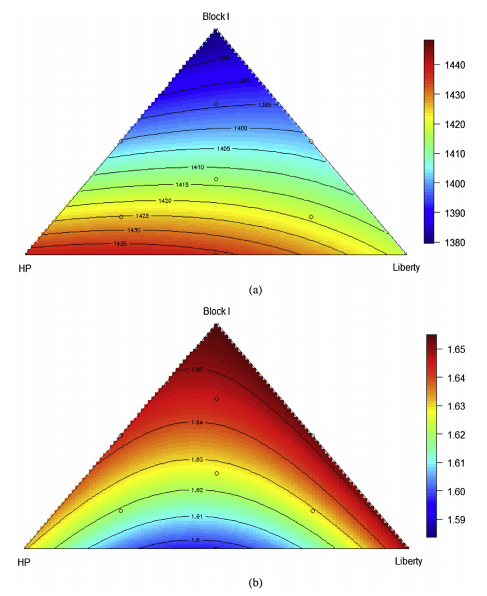
The optimal ratios of the three sorghum-based diets for any bird performance parameter may be calculated from the contour plots generated by the ten dietary treatments. For example, the relationship between proportions of the three basal diets and 7–28 day weight gain weight gain is predicted by the following equation (r2 = 0.99, P < 0.001, lack of fit P = 0.241). In this equation, PBlock I, PHP and PLiberty represent the percentage of diets based on sorghum Block I, HP and Liberty.
Gain = 13.792PBlockI + 14.377PHP + 14.173PLiberty − 0.003158PBlockIPHP + 0.001309PBlockIPLiberty
As illustrated in Fig. 2(a), increasing the inclusion level of diet based on Block I compromised weight gain and the predicted optimal weight gain of 1439 g/bird would be achieved with a diet based on 79.2% HP and 20.8% Liberty but 0.0% Block I. Similarly, the most efficient FCR can be depicted as shown in Fig. 2(b). The relationship between FCR and the proportions of the three basal diets may be predicted by the significant following (r2 = 0.99, P < 0.001, lack of fit P = 0.801) equation:
FCR = 0.01655PBlockI + 0.01631PHP + 0.01651PLiberty − 1.783 × 10⁻⁵PHPPLiberty
Clearly, higher inclusion rates of Block I compromised feed efficiency and the predicted best FCR 1.486 g/g was achieved when the proportions of diets based on Block I, HP and Liberty equal to 0.0%, 55.6% and 44.4%, respectively.
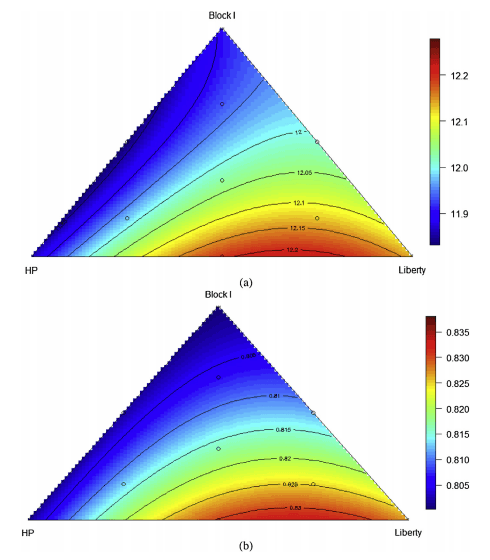
In terms of energy utilisation, as illustrated in Fig. 3(a), the relationship between AMEn and the proportions of three basal diets was predicted by the following equation (r2 = 0.99, P < 0.001, lack of fit P = 0.618):
AMEn = 0.01191PBlockI + 0.1186PHP + 0.1214PLiberty − 1.927 × 10⁻⁵PBlockIPHP − 4.226 ×10⁻⁶PBlockIPLiberty + 7.799 × 10⁻⁵PHP PLiberty
Increasing the inclusion rates of diets based on Block I and HP compromised AMEn and the predicted highest AMEn 12.38 MJ/kg was achieved when the proportions of diets based on Block I, HP and Liberty were equal to 0.0%, 32.0% and 68.0%, respectively.
Fig. 2. Response surfaces of the relationships between the proportions of three basal diets and weight gain (a), feed conversion ratio (b).
Significant differences were confined to AME:GE ratios. Then, as shown in Fig. 3(b), the relationship between AME:GE ratios and the proportions of the three basal diets may be predicted by the following significant (r2 = 0.99, P < 0.001, lack of fit P = 0.992) equation:
ME:GE = 0.008PBlockI + 0.008016PHP + 0.008262PLiberty + 6.520 × 10⁻⁶PHPPLiberty
The predicted maximum AME:GE ratio of 0.845 MJ/MJ will be achieved when the proportions of diets based on Block I, HP and Liberty equal to 0.0%, 31.1% and 68.9%, respectively. Thus, essentially, the most efficient energy utilisation would be generated with diets based on a 69:31 blend of Liberty and HP.
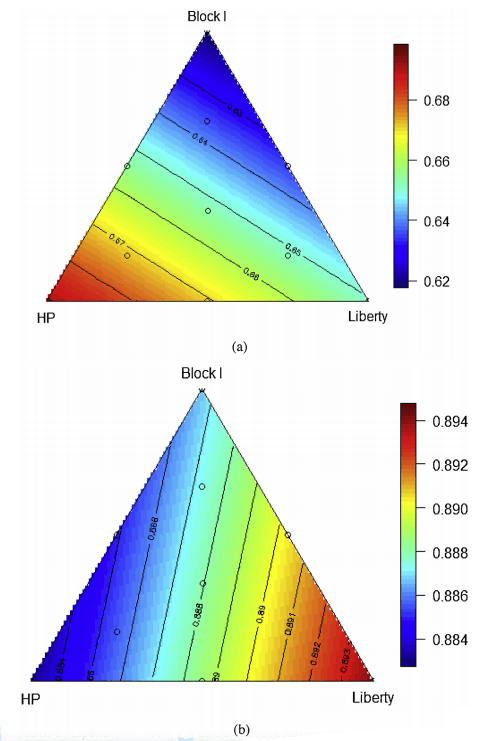
There were multiple linear relationships (r2 = 0.99, P < 0.001, lack of fit P > 0.50) between the proportion ofthree sorghums and distal ileal digestibility coefficients of starch and protein (Fig. 4). The relationship between protein digestibility and the proportions of the three basal diets may be predicted by the following equation:
Distal ileal protein digestibility = 0.00618PBlockI + 0.00691PHP + 0.00651PLiberty
The predicted maximum distal ileal protein digestibility of 0.691 will be achieved when the diet contain 100% sorghum
Fig. 3. Response surfaces of the relationships between the proportions of three basal diets and nitrogen-corrected apparent metabolisable energy (a) and the ratio of metabolisable energy to gross energy (b).
In contrast, the relationship between starch digestibility and the proportions of the three basal diets may be predicted by the following equation:
Distal ileal starch digestibility = 0.00887PBlockI + 0.00883PHP + 0.00894PLiberty
Thepredictedoptimaldistalileal starchdigestibility of 0.894 will be achieved whenthediet contain100%Liberty sorghum.
The concentrations of kafirin, total phenolics and phytate in the three sorghum varieties have been established and therefore, the concentrations of these three components in the ten dietary treatments derived from the sorghum component can be calculated. In this context, kafirin can only be derived from sorghum. Phenolic compounds are presentin soybean meal and canola meal but grain sorghum is a particularly rich source of phenolics (Bravo, 1998). Phytate is also present in soybean meal and canola meal at concentrations in the order of 13.8 g/kg and 22.9 g/kg, respectively (Selle and Ravindran, 2007). Nevertheless, concentrations of phenolics and phytate derived from the two protein meals would remain essentially constant across the dietary treatments and variations in these concentrations would largely stem from the sorghum component. On this basis, the calculated concentrations of kafirin, phytate, total and individual phenolic compounds in the ten experimental diets based on the three sorghums were tabulated in Table 8. The 3-deoxyanthocyanins are mainly concentrated in the grain pericarp and luteolinidin, apigeninidin, 5-methoxy-luteolinidin and 7-methoxy-apigeninidin were detected as the four major polyphenols within this class (Awika et al., 2004; Khoddami et al., 2015); therefore, the total concentrations of 3-deoxyanthocyanins were reported in Table 8.
Fig. 4. Response surfaces of the relationships between the proportions of three basal diets and apparent digestibility coefficients of protein (a) and starch (b) in the distal ileum.
Table 8 Calculated concentrations of kafirin, phytate, total phenolics, anthocyanin, flavan-4-ols and 3-deoxyanthocyanins compounds in the ten experimental diets based on sorghum Block I, HP and Liberty.
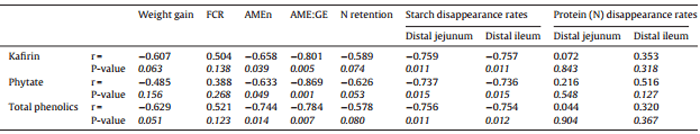
Table 9 Summary of correlations between concentrations of kafirin, total phenolics and phytate in the diets and growth performance and nutrient utilisations in broiler chickens.
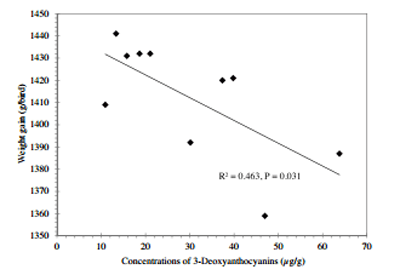
Fig. 5. The negative linear regressions between weight gain and concentrations of 3-deoxyanthocyanins.
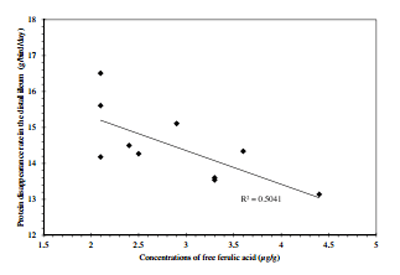
Table 9 summarised the relationships of kafirin, total phenolics and phytate weight growth performance and nutrient utilisations.Concentrations of kafirin,totalphenolics andphytate inthe diets were correlated withstarchdisappearance rates in the distal jejunum and distal ileum (P < 0.02); however, they were not correlated with disappearance rates of protein (N). In addition to Table 9, weight gain was negatively correlated (r = −0.680, P = 0.031)to concentrations of 3-deoxyanthocyanins in the diets (Fig. 5). Feed conversion ratio tended to correlated with dietary concentrations of luteolinidin (r = 0.587, P = 0.074) and 5-methoxy luteolinidin (r = 0.572, P = 0.084). Protein disappearance rate in the distal ileum was negatively correlated to free ferulic acid in the diets (r = −0.710, P = 0.021) as shown in Fig. 6.
4. Discussion
The blends of Liberty and HP to achieve optimal weight gain, FCR and AME:GE are somewhat different but in all instances Block I would be discarded. Phytate and phenolic acids, including ferulic acid, are not unique to sorghum but high levels of polyphenols (Bravo, 1998) and kafirin protein bodies distinguish sorghum from other feed grains. In the present study, Block I sorghum contained 33% more kafirin (67.1 versus 50.5 g/kg), 26% more phenolic compounds (4.68 versus 3.52 mg GAE/g), 30% more phenolic acids (554 versus 427 μg/g) and 26% more phytate (9.79 versus 7.77 g/kg) than HP sorghum. Block I also contained 62% more kafirin (67.1 versus 41.4 g/kg), 56% more phenolic compounds (4.68 versus 3.00 mg GAE/g), 83% more phenolic acids (554 versus 303 g/g) and 99% more phytate (9.79 versus 4.93 g/kg) than Liberty sorghum. Consequently it is not surprising that Block I sorghum was effectively rejected by the triangular contour plots for weight gains, feed conversion ratios and AME:GE ratios or the efficiency of energy utilisation.
Fig. 6. The negative linear regressions between protein disappearance rate in the distal ileum was negatively correlated to free ferulic acid in the diets.
Condensed tannin is a polyphenolic phytochemical with pronounced anti-nutritive properties in poultry (Nyachoti et al., 1997); however, Australian sorghum crops do not presently contain condensed tannin (Khoddami et al., 2015). Nevertheless, as reported by Khoddami et al. (2015), sorghum crops contain a diverse variety of polyphenolic compounds and phenolic acids, which are usually at substantially higher concentrations than other feed grains (Mangan, 1988; Bravo, 1998). It is our contention is that the anti-nutritive properties of phenolic compounds in grain sorghum are not confined to condensed tannin but extend to other ‘non-tannin’ phenols (Liu et al., 2015a). In the present study, weight gain was negatively correlated (r = −0.680, P = 0.031) to concentrations of 3-deoxyanthocyanins in the diets and FCR tended to correlated with dietary concentrations of luteolinidin (r = 0.587, P = 0.074) and 5-methoxy luteolinidin (r = 0.572, P = 0.084). Moreover, protein disappearance rate in the distal ileum was negatively correlated to free ferulic acid in the diets (r = −0.710, P = 0.021). Duodu et al. (2003) suggested that phenolic compounds, including phenolic acids and flavenoids, contain hydroxyl groups and may interact with and form complexes with proteins. The 3-deoxyanthocyanins are mainly concentrated in the grain pericarp and pigmented sorghums are a rich source of unique 3-deoxyanthocyanidins that give yellow to orange color in acidic media (Awika et al., 2004). In Australia, it has been reported that broiler chickens offered white-sorghum-based diets had better performance than chickens offered red-sorghum-based diets (Liu et al., 2013; Selle et al., 2013). In line with the present study, Rooney et al. (2007) showed that tannin-free red sorghum had higher total phenols than white sorghum. Liberty is the only breed of white variety sorghum in Australia and it contained less phytate and kafirin than red sorghums in the present study. Nevertheless, the negative impact of non-tannin phenolics on performance is evident in the present study.
As shown in Table 9, energy utilisation (AMEn and AME:GE ratios) and starch disappearance rates in the distal ileum were negatively influenced by kafirin, total phenolic compounds and phytate concentrations. Multiple linear regression was conducted to compare the relative importance of kafirin, total phenolic compounds and phytate on energy utilisation and they could not be considered separately; therefore, they may be equally important. Kafirin is present in sorghum endosperm as discrete protein bodies with a central core of α-kafirin and a periphery of β- and γ-kafirin fractions. The protein bodies are embedded in the glutelin protein matrix in close association with starch granules (Selle et al., 2010a). This close proximity of kafirin protein bodies and starch granules in sorghum endosperm presumably facilitates any physical and chemical starchprotein interactions which are considered to be important(Rooney and Pflugfelder, 1986), if not clearly defined (Truong et al., 2015). While the underlying mechanisms have yet to be properly clarified, it has been reported that kafirin has the capacity to compromise starch/energy utilisation in grain sorghum in poultry (Salinas et al., 2006). This may be a consequence of disuphide cross-linkages, especially in the β- and γ-kafirin periphery of protein bodies, as Ezeogu et al. (2008) attributed the low starch digestibility of cooked sorghum flour to a more disulfide-bonded protein matrix limiting the expansion of the starch granules and hence amylase access. Moreover, Hamaker and Bugusu (2003) concluded that sorghum proteins, especially kafirin, negatively influence starch gelatinisation and the extent of starch digestion.
The consideration of the interactions between starch and phenolic compounds have been reviewed by Zhu (2015) and Hung et al. (2013) reported that ferulic acid formed complexes with debranched starch ranging from 6.8 to 31.5 mg ferulic acid/g starch. Moreover, Kim et al. (2000) reported that luteolin has the capacity to inhibit -glucosidase and amylase and (Kottra and Daniel, 2007) found that flavonoids inhibit glucose and sodium uptakes via SGLT1 transporters. Earlier, Welsch et al. (1989) had reported that phenolic compounds, including ferulic acid, inhibit Na+-dependent intestinal glucose uptakes in rats. This was attributed to the dissipation of the Na+ electrochemical gradient in the gut mucosa, which drives the active co-absorption of glucose and Na. Phytate also has the capacity to inhibit amylase (Sharma et al., 1978) and depress the activity of Na+/K+-ATPase or the ‘sodium pump’ (Dilworth et al., 2005), which drives the co-absorption of glucose and sodium. It has been suggested that phenolic compounds and phytate share analagous anti-nutritive properties (Selle et al., 2010b) and it appears that these two factors in tandem could compromise the digestion of sorghum starch and, probably more importantly, the subsequent absoprtion of glucose.
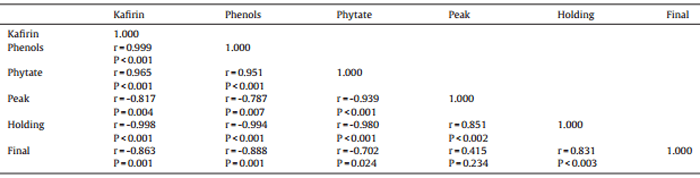
Table 10 Pearson correlations between concentrations of kafirin, total phenolic compounds, phytate in grain sorghum and peak, holding and final RVA starch viscosities.
The influence of concentrations of kafirin, total phenolic compounds, phytate on RVA pasting properties in sorghum per se is tabulated in Table 10. Liu et al. (2014) suggested that although the cooking and cooling during Rapid Visco-Analyses of starch does not duplicate conditions in the gastrointestinal tract of poultry, it should provide information on the effects of the various forms of grain processing on starch properties. Moreover, Doucet et al. (2010) found that final starch viscosity of diets predicted starch digestibility coefficients determined at the small intestinal mid-point in weaner pigs. Therefore, it is possible to consider Rapid Visco-Analyses as a rapid in vitro assessment of starch properties in cereal grains. In the present study, the concentrations of kafirin, total phenolic compounds, phytate were correlated with RVA Peak, Holding and Final viscosity. This again suggested kafirin, total phenolic compounds, phytate may influence functional properties of starch in sorghum grain.
It is noteworthy that sorghums with low protein concentrations may benefit growth performance of broiler chickens (Selle et al., 2010a). Taylor et al. (1984) surveyed 44 grain sorghum varieties; the average protein content was 112 g/kg with proportions of 47.8% kafirin and 24.7% glutelin. Interestingly, the kafirin proportion increased at the expense of glutelin with increasing sorghum protein contents. Kafirin contains low concentrations of basic amino acids including arginine, histidine and especially lysine and the digestibility of amino acids in kafirin is inferior to the ‘non-kafirin’ component of sorghum protein (Shull et al., 1992; Watterson et al., 1993; Selle et al., 2010a). It is probable that high protein sorghums contain higher proportions of kafirin and lower amino acid digestibilities than low protein sorghums. Moreover, Liu and Selle (2015) considered the importance of digestive dynamics of starch and protein; protein digestion in the proximal small intestine may be more important for both protein utilisation and feed conversion efficiency. Therefore, both the extent and rate of protein digestion are pivotal to growth performance in broiler chickens. In order to formulate nutritionally adequate diets, diets based on low protein sorghums require higher inclusions of other protein sources, including soybean meal and synthetic amino acids. In practice, broiler diets are formulated to contain adequate digestible amino acid concentrations rather than total amino acids. Therefore, diets based on low protein sorghums contain higher levels of soybean meal and synthetic amino acids and have more rapid rates of protein digestion which should benefit feed conversion efficiency.
5. Conclusions
In conclusion, the present study indicates that a model sorghum variety for chicken-meat production would be relatively high in starch but low in protein. A low-protein sorghum would automatically contain less kafirin and would be enhanced further if the kafirin proportion of protein was also reduced. Ideally this model sorghum would also contain relatively low levels of polyphenols and phenolic acids. While phytate, possibly in tandem with phenolic compounds, is a negative in the overall equation, the deleterious effects of sorghum phytate can be counteracted by the inclusion of exogenous phytases in sorghum-based diets, which is a routine procedure. Indeed, more robust phytase responses in broiler chickens well may be observed when they are offered diets based on such a model sorghum simply because phytase cannot ameliorate the anti-nutritive properties of kafirin and phenolic compounds.
Conflict of interest
The authors declare no conflicts of interest.
Acknowledgments
We would particularly like to thank Dr Karlie Nielsen for quantifying kafirin in sorghum while at the Australian Proteome Analysis Facility (Macquarie University) and Dr David Cadogan (Feedworks) for formulating the diets. We would like to acknowledge the Chicken-meat Committee of the Rural Industries Research and Development Corporation (RIRDC) for their ongoing encouragement and financial support (PRJ-008695) and thePoultry Cooperative Research Centre for their support of Ms Ha Truong’s PhD candidature.
This article was originally published in Animal Feed Science and Technology 218 (2016) 70-83. This is an open access article under the CC BY-NC-ND license (http://creativecommons.org/licenses/by-nc-nd/4.0/).
References
Awika, J.M., Rooney, L.W., Waniska, R.D., 2004. Properties of 3-deoxyanthocyanins from sorghum. J. Agric. Food Chem. 52, 4388–4394.
Black, J.L., Hughes, R.J., Nielsen, S.G., Tredrea, A.M., MacAlpine, R., Van Barneveld, R.J., 2005. The energy value of cereal grains, particularly wheat and sorghum, for poultry. Proc. Aust. Poult. Sci. Symp. 17, 21–29.
Bravo, L., 1998. Polyphenols: Chemistry, dietary sources, metabolism, and nutritional significance. Nutr. Rev. 56, 317–333.
Cohen, S.A., Michaud, D.P., 1993. Synthesis of a fluorescent derivatizing reagent, 6-aminoquinolyl-n-hydroxysuccinimidyl carbamate, and its application for the analysis of hydrolysate amino-acids via high-performance liquid-chromatography. Anal. Biochem. 211, 279–287.
Dilworth, L.L., Omoruyi, F.O., Asemota, H.N., 2005. Digestive and absorptive enzymes in rats fed phytic acid extract from sweet potato (Ipomoea batatas). Diabetol. Croat. 34, 59–65.
Doucet, F.J., White, G.A., Wulfert, F., Hill, S.E., Wiseman, J., 2010. Predicting in vivo starch digestibility coefficients in newly weaned piglets from in vitro assessment of diets using multivariate analysis. Br. J. Nutr. 103, 1309–1318.
Duodu, K.G., Taylor, J.R.N., Belton, P.S., Hamaker, B.R., 2003. Factors affecting sorghum protein digestibility. J. Cereal Sci. 38, 117–131.
Ezeogu, L.I., Duodu, K.G., Emmambux, M.N., Taylor, J.R.N., 2008. Influence of cooking conditions on the protein matrix of sorghum and maize endosperm flours. Cereal Chem. 85, 397–402.
Hamaker, B.R., Bugusu B.A., 2003. Overview: sorghum proteins and food quality. In: Afripro Workshop on the Proteins of Sorghum and Millets: Enhancing Nutritional and Functional Properties for Africa. Pretoria, South Africa, 2–4 April 2003.
Hamaker, B.R., Mohamed, A.A., Habben, J.E., Huang, C.P., Larkins, B.A., 1995. Efficient procedure for extracting maize and sorghum kernel proteins reveals higher prolamin contents than the conventional method. Cereal Chem. 72, 583–588.
Hill, F.W., Anderson, D.L., 1958. Comparison of metabolizable energy and productive energy determinations with growing chicks. J. Nutr. 64, 587–603.
Hung, P.V., Phat, N.H., Phi, N.T.L., 2013. Physicochemical properties and antioxidant capacity of debranched starch-ferulic acid complexes. Starch-Starke 65, 382–389.
Khoddami, A., Truong, H.H., Liu, S.Y., Roberts, T.H., Selle, P.H., 2015. Concentrations of specific phenolic compounds in six red sorghums influence nutrient utilisation in broiler chickens. Anim. Feed Sci. Technol. 210, 190–199.
Kim, J.S., Kwon, C.S., Son, K.H., 2000. Inhibition of alpha-glucosidase and amylase by luteolin, a flavonoid. Biosci. Biotechnol. Biochem. 64, 2458–2461.
Kottra, G., Daniel, H., 2007. Flavonoid glycosides are not transported by the human Na+/glucose transporter when expressed in Xenopus laevis oocytes, but effectively inhibit electrogenic glucose uptake. J. Pharmacol. Exp. Ther. 322, 829–835.
Liu, S.Y., Selle, P.H., 2015. A consideration of starch and protein digestive dynamics in chicken-meat production. World Poult. Sci. J. 71, 297–310.
Liu, S.Y., Selle, P.H., Cowieson, A.J., 2013. Influence of white- and red-sorghum varieties and hydrothermal component of steam-pelleting on digestibility coefficients of amino acids and kinetics of amino acids, nitrogen and starch digestion in diets for broiler chickens. Anim. Feed Sci. Technol. 186, 53–63.
Liu, S.Y., Selle, P.H., Khoddami, A., Roberts, T.H., Cowieson, A.J., 2014. Graded inclusions of sodium metabisulphite in sorghum-based diets: II. Modification of starch pasting properties in vitro and beneficial impacts on starch digestion dynamics in broiler chickens. Anim. Feed Sci. Technol. 190, 68–78.
Liu, S.Y., Fox, G., Khoddami, A., Neilson, K.A., Truong, H.H., Moss, A.F., Selle, P.H., 2015a. Grain sorghum: a conundrum for chicken-meat production. Agriculture 5, 1224–1251.
Liu, S.Y., Selle, P.H., Simpson, S.J., Cowieson, A.J., Raubenheimer, D., 2015b. The euclidian pathway to more instructive broiler bioassays: nutritional geometry. Proc. Aust. Poult. Sci. Symp. 26, 52–60.
Mahasukhonthachat, K., Sopade, P.A., Gidley, M.J., 2010. Kinetics of starch digestion and functional properties of twin-screw extruded sorghum. J. Cereal Sci. 51, 392–401.
Mangan, J.L., 1988. Nutritional effects of tannins in animal feeds. Nutr. Res. Rev. 1, 209–231.
Nyachoti, C.M., Atkinson, J.L., Leeson, S., 1997. Sorghum tannins: a review. World Poult. Sci. J. 53, 5–21.
Raubenheimer, D., 2011. Toward a quantitative nutritional ecology: the right-angled mixture triangle. Ecol. Monogr. 81, 407–427.
Riesenfeld, G., Sklan, D., Bar, A., Eisner, U., Hurwitz, S., 1980. Glucose-absorption and starch digestion in the intestine of the chicken. J. Nutr. 110, 117–121.
Rooney, L.W., Pflugfelder, R.L., 1986. Factors affecting starch digestibility with special emphasis on sorghum and corn. J. Anim. Sci. 63, 1607–1623.
Rooney, W.L., Blumenthal, J., Bean, B., Mullet, J.E., 2007. Designing sorghum as a dedicated bioenergy feedstock. Biofuels Bioprod. Biorefin. 1, 147–157.
Salinas, I., Pro, A., Salinas, Y., Sosa, E., Becerril, C.M., Cuca, M., Cervantes, M., Gallegos, J., 2006. Compositional variation amongst sorghum hybrids: effect of kafirin concentration on metabolizable energy. J. Cereal Sci. 44, 342–346.
Selle, P.H., Ravindran, V., 2007. Microbial phytase in poultry nutrition. Anim. Feed Sci. Technol. 135, 1–41.
Selle, P.H., Cadogan, D.J., Li, X., Bryden, W.L., 2010a. Implications of sorghum in broiler chicken nutrition. Anim. Feed Sci. Technol. 156, 57–74.
Selle, P.H., Ravindran, V., Cowieson, A.J., Bedford, M.R., 2010b. Phytate and Phytase. Cabi Publishing-C a B Int., Cabi Publishing, Wallingford 0x10 8de, Oxon, Uk.
Selle, P.H., Liu, S.Y., Cai, J., Cowieson, A.J., 2013. Steam-pelleting temperatures, grain variety, feed form and protease supplementation of mediumly-ground sorghum-based broiler diets: influences on growth performance, relative gizzard weights, nutrient utilisation, starch and nitrogen digestibility. Anim. Prod. Sci. 53, 378–387.
Sharma, C.B., Goel, M., Irshad, M., 1978. Myoinositol hexaphosphate as a potential inhibitor of alpha-amylases. Phytochemistry 17, 201–204.
Shull, J.M., Watterson, J.J., Kirleis, A.W., 1992. Purification and immunocytochemical localization of kafirins in sorghum-bicolor (l-moench) endosperm. Protoplasma 171, 64–74.
Siriwan, P., Bryden, W.L., Mollah, Y., Annison, E.F., 1993. Measurement of endogenous amino-acid losses in poultry. Br. Poult. Sci. 34, 939–949.
Skoglund, E., Carlsson, N.G., Sandberg, A.S., 1997a. Analysis of inositol mono- and diphosphate isomers using high-performance ion chromatography and pulsed amperometric detection. J. Agric. Food Chem. 45, 4668–4673.
Skoglund, E., Carlsson, N.G., Sandberg, A.S., 1997b. Determination of isomers of inositol mono- to hexaphosphates in selected foods and intestinal contents using high-performance ion chromatography. J. Agric. Food Chem. 45, 431–436.
Symes, K.J., 1965. Inheritance of grain hardness in wheat as measured by particle size index. Aust. J. Agric. Res. 16, 113–123.
Taylor, J.R.N., Schussler, L., Vanderwalt, W.H., 1984. Fractionation of proteins from low-tannin sorghum grain. J. Agric. Food Chem. 32, 149–154.
Truong, H.H., Liu, S.Y., Selle, P.H., 2015. Starch utilisation in chicken-meat production: the foremost influential factors. Anim. Prod. Sci. http://dx.org/10.1071/an15056.
Wallace, J.C., Lopes, M.A., Paiva, E., Larkins, B.A., 1990. New methods for extraction and quantitation of zeins reveal a high content of gamma-zein in modified opaque-2 maize. Plant Physiol. 92, 191–196.
Watterson, J.J., Shull, J.M., Kirleis, A.W., 1993. Quantitation of alpha-karafins beta-karafins, and gamma-kafirins in vitreous and opaque endosperm of sorghum-bicolor. Cereal Chem. 70, 452–457.
Welsch, C.A., Lachance, P.A., Wasserman, B.P., 1989. Dietary phenolic-compounds − inhibition of Na+-dependent D-glucose uptake in rat intestinal brush-border membrane-vesicles. J. Nutr. 119, 1698–1704.
Zhu, F., 2015. Interactions between starch and phenolic compound. Trends Food Sci. Tech. 43, 129–143.