INTRODUCTION
Currently, a method to increase growth, improve feed efficiency, and increase leanness is incorporation of ractopamine hydrochloride (RAC; Paylean, Elanco Animal Health, Greenfield, IN) into the diet of finishing pigs for the last 20.4 to 40.8 kg of BW gain. Numerous studies have reported these benefits as well as increased carcass weight and dressing percentage with negligible effects on meat quality (Watkins et al., 1990; Stites et al., 1991; Uttaro et al., 1993; Crome et al., 1996; Carr et al., 2005a,b, 2009; Mimbs et al., 2005; Apple et al., 2007). Response to RAC, however, is influenced by dosage, duration, and dietary protein concentration (Stites et al., 1991; Williams et al., 1994; Edmonds and Baker, 2010). Current RAC label recommendations suggest using the product with a diet formulated to include at least 16% CP. This level is greater than the more commercially representative NRC CP requirement of 13% for finishing pigs (NRC, 1998). Most historical research compared RAC-fed pigs with controls when both groups were fed a high protein diet. Limited research has compared RAC-treated pigs fed a diet high in CP (+16%) with control pigs fed a NRC CP level (13%). Boler et al. (2011), however, reported RAC-fed pigs fed a diet formulated with 16.98% CP had heavier ending BW, heavier HCW, and larger loin depths than control pigs fed a diet formulated with 13.22% CP.
Webster et al. (2007) were unable to demonstrate a linear response in any carcass characteristics (dressing percentage, HCW, fat thickness, percentage lean, or loin eye area) when dietary CP was increased from 13.2 (0.60% total Lys) to 24.5% (1.40% total Lys). However, dietary protein content may affect RAC response. Dunshea et al. (1993) reported that as dietary protein content increased from 8.5 to 22.2% (in approximate increments of 2.7%), feeding of RAC (fed at 20 mg/kg) elicited a linear increase in ADG and protein deposition. In general, shorter feeding durations of RAC are required to elicit a response in growth performance, but longer durations are required to change carcass composition. Armstrong et al. (2004) reported improvements in ADG and feed efficiency in only 6 d of feeding RAC at 5 and 10 mg/kg, but differences in 10th-rib loin eye area and fat-free carcass lean were not detectable until 27 d of feeding at 10 mg/kg of RAC and 34 d of feeding at 5 mg/kg of RAC.
The experimental design of the study was similar to Armstrong et al. (2004), but designed to allow for comparison of a control group of pigs fed a high CP diet (17.8%) as well as an industry applicable NEG control group (13% CP) of pigs with various doses and durations of RAC. The objectives of the study were to investigate the effects of RAC fed at 5.0 and 7.4 mg/kg for 0, 7, 14, 21, 28, or 35 d on carcass characteristics and meat quality.
MATERIALS AND METHODS
No approval was obtained from the University of Illinois Institutional Animal Care and Use Committee for the carcass phase of the experiment because no live animals were used in the experiment. Carcasses were obtained from a federally inspected slaughter facility. Experimental procedures during the live phase followed the guidelines stated in the Guide for the Care and Use of Agricultural Animals in Research and Teaching (FASS, 2010).
Experimental Design and Treatments
Approximately 1,700 commercial finishing pigs (PIC TR-4 × PIC C22, Pig Improvement Company, Hendersonville, TN) were randomly assigned to 1 of 86 single-sex pens of approximately 20 pigs per pen. Initial allotting BW was 93 kg. Pigs were slaughtered on 2 different days, and slaughter day was considered a block. Blocks were made of single-sex replicates, which consisted of 12 pens (1 pen per treatment group). Block one (slaughter d 1) consisted of 2 barrow replicates and 1 gilt replicate. Block 2 (slaughter d 2) consisted of 2 gilt replicates, 1 barrow replicate, 1 incomplete gilt replicate, and 1 incomplete barrow replicate. Two control diets that did not include RAC were used in this study (Table 1), negative (NEG; 13% CP, 0.64 TID Lys) and positive (POS; 17.8% CP, 0.94 TID Lys). Percent lysine in the NEG diet was based on NRC requirements for finisher pigs (NRC, 1998). The RAC treatments, 5.0 and 7.4 mg/kg of RAC, were formulated with the POS diet (Table 1) and were fed for 0-, 7-, 14-, 21-, 28-, or 35-d durations. Percentage lysine in the POS and RAC diets was based on previous work for genotype and environment (Fernández-Dueñas et al., 2008) and the lysine dosage studies of Webster et al. (2007). All pigs received the NEG diet before initiation of RAC treatment feed. The 35-d duration groups received treatment feed at allotment. The 28-d duration groups began receiving treatment feed 7 d after allotment. The 21-d duration groups began receiving treatment feed 14 d after allotment. The 14-d duration groups began receiving treatment feed 21 d after allotment. The 7-d duration groups began receiving treatment feed 28 d after allotment. On d 35 of each block, individual pig BW were collected on 2 replicates in each block (1 barrow, 1 gilt), for the purpose of selecting the 5 pigs from each pen (24 pens per block) with BW closest to the pen average. This subset of 240 pigs was identified and used for detailed carcass and meat quality analysis.
Product Collection and Carcass Data
Pigs were transported 628 km during the summer to a federally inspected slaughter facility. Pigs were slaughtered on 2 different days and were immobilized with electrical stunning. Hot carcass weights were measured before entering the coolers. Fat depth, muscle depth, and percentage lean were measured using the Animal Ultrasound System (Animal Ultrasound Services and Co. Inc., Ithaca, NY). After a 24-h chill, carcasses were fabricated, and right side primals, consisting of the shoulder, loin, belly, and ham, were transported to the University of Illinois Meat Science Laboratory for processing. Weights of primals, boneless cuts, and all intermediate cuts were collected. All presented weights represent the weights of the respective cuts from a single side of the carcass. The number associated with the cut description shown in Tables 3 to 8 is the Institutional Meat Purchase Specification (IMPS, 1996), North American Meat Processors Association (NAMP, 1997) number of the cut most closely associated with actual cut specifications. Primals, boneless cuts, and all intermediate cut yields are expressed as a percentage of HCW and were calculated using the following equation: % of HCW = [(2 × actual cut weight)/HCW] × 100. Lean cut yields were calculated from the collected weights with the following formula: [(inside ham + outside ham + knuckle + light butt + Canadian back + tenderloin + sirloin + boneless Boston butt + boneless picnic) × 2)/HCW] × 100. The carcass cut yield is the lean cut yield plus the trimmed belly.
Meat Quality
Meat quality variables were assessed on Canadian back loins (IMPS-414). Meat quality traits, measured at approximately the 10th rib, included subjective color and marbling scores (NPPC, 1999), subjective firmness (NPPC, 1991), Japanese lean color score (Nakai et al., 1975), and objective color utilizing a Minolta CR-300 with a D65 light source and a 0° observer (Minolta Camera Company, Osaka, Japan). Chop collection starting anterior to the 10th rib included a 1.3-cm thick chop for drip loss; a 2.54-cm-thick chop for proximate composition analysis; four 2.54-cm-thick chops for Warner-Bratzler shear force determination. Chops for shear force determination were aged for 3, 7, 14, or 21 d. Proximate composition of moisture was determined with oven drying, and extractable lipid from loin chops was determined by extraction with an azeotropic chloroform and methanol mixture as described by Novakofski et al. (1989). To assess fresh meat quality of the ham, pH and objective color were measured on the lightest portion of the inside surface on the semimembranosus muscle.
Statistical Analysis
A 1-way ANOVA (MIXED procedure, SAS Inst. Inc., Cary, NC) was used to evaluate the effects of dose and duration of RAC, and dietary CP on various outcome variables. The pen served as the experimental unit. The only fixed effect in the statistical model was treatment. Block (slaughter date) and replicate within block were included as random effects. If any of these random effects were statistically insignificant (P > 0.05), they were dropped from the model. As mentioned previously, only single-sex replicates were utilized in this study. Therefore, sex was not included in the model; however, the variation due to sex was accounted for by including replicate in the model. Differences due to dosage were not significant (P > 0.05), so RAC dosages of 5 and 7.4 mg/kg were pooled to an average dose of 6.2 mg/ kg, thus resulting in 7 treatment groups (NEG, POS, 7-d RAC, 14-d RAC, 21-d RAC, 28-d RAC, and 35-d RAC). A comparison of the NEG control group with the RAC-fed group provides practical production application to industry because if producers do not feed RAC, they will not feed a diet that has 17.8% CP.
On the other hand, inclusion of the POS control group provides a balanced experimental design and allows for comparison of pigs (RAC vs. POS) when the treatment groups are fed the same diet. Therefore, NEG and POS treatments groups were not pooled for statistical analysis and were reported independently. Six orthogonal contrasts were used to evaluate the objectives of this study: contrast 1, NEG control vs. POS control; contrast 2, NEG control vs. all RAC groups; contrast 3, POS control vs. all RAC groups; contrast 4, linear effects of duration within RAC (RAC duration 7 d through 35 d); contrast 5, quadratic effects of duration within RAC (RAC duration 7 d through 35 d); and contrast 6, POS control vs. 35-d RAC duration. Contrast 6 allows for the comparison of control pigs (not fed RAC) with pigs fed RAC for 35 d without the confounding factor of CP percentage.
RESULTS AND DISCUSSION
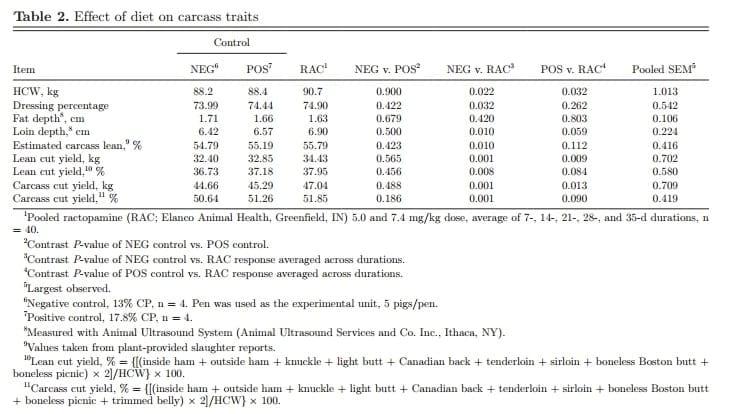
As mentioned above, there were no significant differences between the 2 RAC doses (5.0 and 7.4 mg/ kg of RAC; P > 0.10) for any of the carcass or meat quality variables measured; therefore, dose was pooled. Also, there were no differences between NEG and POS control diets (P > 0.150), indicating lysine was not deficient for the carcass traits measured in the NEG diet. Additionally, carcass leanness measures (fat depth, P = 0.679; and estimated carcass lean, P = 0.423) were not different, further indicating POS and NEG controls were not different.
Data are presented in 2 different tables for each variable (carcass traits, wholesale cut weights, trimmed wholesale cut weights, boneless cut weights, and fresh meat quality traits). In the first of the 2 tables, NEG and POS diets are compared with all RAC groups (7, 14, 21, 28, and 35 d). A comparison of the NEG control group with the RAC treatment groups has practical production application to industry because if producers do not feed RAC, they will not feed a diet that has 17.8% CP. Producers are interested in seeing the advantages of feeding RAC to pigs compared with pigs that would be fed a practical alternative diet with a decreased percentage of CP. On the other hand, a comparison of RAC with pigs fed the POS control diet allows for separation of parameter estimate differences between RAC and control from differences in CP inclusion. The effects of RAC duration are summarized in the second table for each variable.
Carcass Traits
Effects of diet and RAC feeding duration on carcass traits are presented in Tables 2 and 3, respectively. Hot carcass weights of RAC-fed pigs were 2.5 kg heavier than NEG controls (88.2 kg; P = 0.022) and 2.3 kg heavier than POS controls (88.4 kg; P = 0.032). Hot carcass weight also increased linearly (P = 0.003) over the 35-d RAC treatment duration, and at 35 d the HCW was 3.5 kg heavier (P = 0.007) than POS (Table 3). Similar increases in HCW, approximately 4 kg, were seen in both light BW (107 kg) and heavy BW (125 kg) pigs fed 10 or 20 mg/kg of RAC for approximately the last 40 kg of BW gain (Crome et al., 1996). Effects of RAC on HCW are well documented and tend to increase by 2.3% over controls when fed at 5 mg/kg and 3.2% over controls when fed at 10 mg/kg (Apple et al., 2007). Therefore, the 2.8% improvement over NEG and 2.5% improvement over POS was expected.
Webster et al. (2007) reported no change in HCW or dressing percentage when pigs were not fed RAC, but fed increasing dietary lysine. Therefore, the lack of difference in HCW (P = 0.90) and dressing percentage (P = 0.42) between NEG control and POS control (Table 2) was also not surprising.
Dressing percentage in RAC-fed pigs (74.90%) was greater (P = 0.032) than the dressing percentage of NEG controls (73.99%). Historically, RAC fed at 5 mg/ kg increased dressing percentage between 0.3 and 2.0% when compared with controls (Apple et al., 2007). Loin depth was 0.48 cm larger (P = 0.010) in the RACfed pigs when compared with the NEG controls (6.42 cm; Table 2). These data are typical of historical data where an increase in loin depth was reported in 3 of 4 experiments comparing controls with pigs fed 5 mg/kg and an increase in loin depth in 8 of 9 experiments comparing controls with pigs fed 10 mg/kg (Apple et al., 2007). Backfat depth was unaffected (P = 0.420 NEG vs. RAC; P = 0.803 POS vs. RAC; Table 2) by the overall RAC treatment; however, there was a trend for a linear decrease (P = 0.077) in fat depth as the RAC duration increased (Table 3). These results were not unexpected. Though polynomial contrast data were not analyzed, Armstrong et al. (2004) reported no differences in backfat thickness of pigs fed 5 mg/kg of RAC (3 mm; maximum thickness − minimum thickness) or 10 mg/kg of RAC (4.3 mm; maximum thickness − minimum thickness) for 6 to 34 d. The magnitude of the difference in the current study (1.9 mm) was even less. Historically greater doses have been required to observe significant reductions in backfat thickness. The literature is inconclusive with regard to the effect of RAC on fat depth. Previous research has found no difference (P > 0.05) in first rib, 10th rib, last rib, or last lumbar fat depths (Carr et al., 2005a), and Armstrong et al. (2004) also found no difference (P > 0.05) in 10th-rib backfat. However, other research has demonstrated reductions in fat depth (Williams et al., 1994; Crome et al., 1996). In the current study, NEG estimated carcass leanness was increased (P = 0.010) by RAC to 55.79 from 54.79% (Table 2). At 35 d, compared with POS, RAC had increased (P = 0.039) estimated carcass lean percentage (56.11 vs. 55.19%; Table 3). Increases in carcass leanness are consistent with previous literature (Bark et al., 1992; Carr et al., 2009).
In an experiment using 216 barrows and gilts (6 experimental units per treatment) comparing a lowenergy diet (3,300 kcal/kg) to a high-energy diet (3,480 kcal/kg), ME did not affect ADG, ADFI, or loin muscle area over a 28-d feeding period (Apple et al., 2004), but pigs fed a greater energy diet did have a greater BW-gain-to-feed ratio. On the other hand, when lysine:ME increased, a linear increase in ADG and G:F was reported. Additionally, a linear decrease was reported for 10th-rib fat depth and a linear increase was reported for loin muscle area, ham weight, lean weight, and percentage lean yield (Apple et al., 2004). Hot carcass weight was not different between the energy levels, but dressing percentage improved as lysine:ME increased from 1.7 (73.38%) to 2.4 (74.17%; Apple et al., 2004).
In another experiment using only gilts (n = 18 experimental units per treatment), no statistical differences were reported for ending BW, ADG, or ADFI. An increase in G:F was reported when lysine was increased from 4.8 g/kg (1.68 lysine:ME) to 6.4 g/kg (2.00 lysine:ME; Witte et al., 2000). However, the magnitude of difference between low-energy and high-energy diets for ADG was similar (0.037 kg; Witte et al., 2000 vs. 0.039 kg; Apple et al., 2004) between the 2 experiments. Hot carcass weight and dressing percentage were not different between pigs fed 4.8 g/kg of lysine and pigs fed 6.4 g/kg of lysine (Witte et al., 2000). Fat depth (10th rib) was less, but loin eye area and carcass lean percentage were improved in gilts fed 6.4 g/kg of lysine compared with gilts fed 4.8 g/kg of lysine (Witte et al., 2000).
Webster et al. (2007) did not report a linear change in backfat thickness, loin eye area, or lean percentage, but did report a linear increase in protein accretion as lysine increased in the diet from 0.6 to 1.2% (n = 12 experimental units per treatment).
Carcass Cutting Yields
Effects of diet and RAC duration on cutting yields are presented in Tables 2 and 3, respectively. Carcass cutting yields of RAC-fed pigs (51.85%) were greater (P = 0.001) than NEG controls (50.64%). Lean cutting yields were also greater (P = 0.008) for RAC-fed pigs (37.95%) compared with NEG control (36.73%; Table 2). Lean cutting yield was greater (P = 0.084) for RAC-fed pigs (37.95%) compared with POS control (37.18%). Pigs fed RAC for 35 d had greater lean cut yields (P = 0.009) and greater carcass cut yields (P = 0.013) compared with POS controls (Table 3). Both carcass cut yield (P = 0.004) and lean cut yield (P = 0.003) increased linearly as the RAC duration increased (Table 3). Pigs fed RAC for 35 d produced over 3 kg more cut yield product than the NEG control, whereas the POS control only produced just over 0.5 kg of additional cut yield product (Figure 1), indicating the advantage in cutting yields was primarily attributed to a RAC response more than a dietary protein response. Even though there were no differences in lean cutting yields or carcass cutting yields among the NEG and POS controls, the advantage in total product equated to approximately 9% more lean cutting yield product (1.86 percentage units; Figure 2) and 7% more carcass cutting yield product (1.67 percentage units; Figure 2) of RAC-fed pigs when compared with NEG controls. Additionally, cutting yields of pigs fed RAC for 35 d improved 1.86 percentage units for lean cut yields and 1.67 percentage units for carcass cutting yields over NEG controls, whereas POS controls only improved 0.44 percentage units for lean cut yields and 0.62 percentage units for carcass cutting yields (Figure 2).
Effects of diet and RAC duration on wholesale cut weights are presented in Tables 4 and 5, respectively. Fresh ham (IMPS-401) weight was increased (P = 0.036) 0.35 kg from the NEG weight of 10.37 kg and increased (P = 0.021) 0.39 kg from POS weight of 10.33 (Table 3). Fresh ham weight increased linearly (P = 0.014) as duration increased, and at 35 d it was 0.56 kg heavier (P < 0.001) than POS (Table 5). Shoulder (IMPS-403) weight increased (P = 0.035) 0.28 kg from POS weight of 10.30 kg (Table 3). Shoulder weight also increased linearly (P = 0.005) as the durations increased, and by 35 d, RAC was 0.44 kg heavier (P = 0.007) than POS (Table 5). Belly (IMPS-408) weights increased (P = 0.086) 0.33 kg over the NEG weight of 8.71 kg (Table 4).
Effect of diet and RAC duration on trimmed wholesale weights and as a percentage of HCW is presented in Tables 6 and 7, respectively. Fresh ham (IMPS- 401C) weight of RAC-fed pigs (9.35 kg) were 0.42 kg heavier (P = 0.014) than fresh ham weights of NEG control-fed pigs (8.93 kg) and 0.43 kg heavier (P = 0.011) than fresh ham weights of POS control-fed pigs (8.92 kg; Table 6). Fresh ham weight was increased (P < 0.001) 0.66 kg, and percentage of HCW increased (P = 0.043) to 20.84% with 35-d duration compared with POS (20.18%). There was also a linear increase in fresh ham weight (P = 0.002) duration response (Table 7). In the current study, picnic (IMPS-405) weight was increased (P = 0.028) 0.17 kg from the POS weight of 4.64 kg (Table 6). As RAC duration increased, there was a linear increase in picnic weight (P = 0.009), and at 35 d the weight was 0.24 kg heavier (P = 0.007; Table 7). Boston butt (IMPS-406) weight increased (P = 0.082) 0.11 kg from the NEG weight 3.85 kg and increased (P = 0.004) 0.19 kg from the POS weight of 3.77 kg (Table 6). Boston butt weight increased (P < 0.001) linearly over time with RAC, and at 35 d it was 0.30 kg heavier (P = 0.002) than POS and was a greater proportion (P = 0.011) of HCW (Table 7). Skin-on belly (IMPS-409B) weights were not affected by RAC inclusion compared with either NEG (P = 0.232) or POS (P = 0.568). Loin (IMPS-410) weight increased (P = 0.002) 0.53 kg from the NEG weight of 9.69 kg, and increased (P = 0.066) 0.30 kg from the POS weight of 9.92 kg. Loin percentage of HCW increased (P = 0.027) to 22.55% from the NEG percentage of 21.98% (Table 6). Loin weight and percentage of HCW both increased linearly (P < 0.001) with increasing duration of treatment, and at 35-d loin weight increased 0.71 kg from POS and percentage of HCW increased to 23.15% from POS percentage of HCW, 22.45% (Table 7).
Effect of diet and RAC duration on boneless cut weights and as a percentage of HCW is presented in Tables 8 and 9, respectively. Fresh ham inside (IMPS- 402F) weight increased linearly (P = 0.030) over the test period as RAC duration increased (Table 9). Fresh ham outside (IMPS-402E) weight was increased (P = 0.122) 0.11 kg from the NEG weight of 2.22 kg, and increased (P = 0.035) 0.15 kg from the POS weight of 2.18 kg (Table 8). Outside ham weight (P = 0.006) and percentage of HCW (P = 0.055) increased linearly with RAC duration, and weight at 35 d was increased 0.23 kg from POS, and percentage of HCW increased to 5.24% from POS of 4.93% (Table 9). Knuckle weight was increased 0.10 kg from NEG weight of 1.11 kg, and percentage of HCW was increased to 2.68% compared with NEG of 2.51%. Light butt weight increased (P = 0.035) 0.04 kg from POS, and percentage HCW increased (P = 0.044) to 0.46% from POS, 0.38% (Table 8). There was also a positive quadratic response for light butt in weight and percentage of HCW (P = 0.032; Table 9). Picnic (IMPS-405A) weight was increased (P = 0.040) 0.14 kg from NEG weight of 3.37 kg, and increased (P = 0.019) 0.16 kg from POS weight of 3.35 kg (Table 8).
Picnic weight increased linearly (P = 0.013) with RAC duration, and at 35 d it was 0.22 kg heavier (P = 0.006) than POS (Table 9). Boston butt (IMPS-406) weight was increased (P = 0.016) 0.14 kg from NEG weight of 3.46, and increased (P = 0.001) 0.20 kg from POS of 3.40 kg. Boston butt percentage of HCW was increased (P = 0.023) to 7.94% from POS of 7.69% (Table 9). Boston butt weight increased linearly (P < 0.001) with RAC duration, and at 35 d it was 0.30 kg heavier (P < 0.001) than POS and percentage of HCW was increased (P = 0.006) to 8.06% from POS of 7.69%. Cellar trimmed butt (IMPS-407) weight was increased (P = 0.015) 0.09 kg from POS weight of 1.61 kg (Table 8). Cellar trimmed butt also increased linearly (P = 0.001) with RAC duration. After 35 d of RAC, cellar trimmed butt weight was increased (P = 0.001) 0.15 kg and percentage of HCW was increased (P = 0.035) to 3.83% from POS of 3.65% (Table 9). Clear plate was decreased (P < 0.001) 0.11 kg from NEG weight of 0.98 kg. Clear plate as a percentage of HCW was decreased (P < 0.001) to 1.91% from NEG of 2.23%, and was less (P = 0.020) than POS of 2.06% (Table 8). Clear plate percentage of HCW weight decreased linearly (P = 0.003) with RAC duration, and at 35 d it was reduced to 1.82% of HCW (Table 9). Canadian back (IMPS- 414) weight was increased (P < 0.001) 0.32 kg from NEG weight of 3.10 kg, and increased (P = 0.023) 0.16 kg from POS weight of 3.26 kg. Canadian back weight as a percentage of HCW was increased (P < 0.001) to 7.53% from the NEG of 7.03% (Table 8). Both Canadian back weight and percentage of HCW increased linearly (P < 0.001), and after 35 d of RAC, weight was increased (P < 0.001) 0.32 kg from POS, and percentage of HCW was increased (P = 0.006) to 7.79% from POS of 7.38% (Table 9). Tenderloin (IMPS-415A) weight was increased (P < 0.001) 0.05 kg from NEG of 0.40 kg, and increased (P = 0.001) 0.04 kg from POS of 0.41 kg. Tenderloin as a percentage of HCW was increased (P < 0.01) to 1.0% compared with 0.90 and 0.93%, respectively, for the NEG and POS diets (Table 8). Tenderloin weight and percentage of HCW also increased linearly (P < 0.001) with RAC duration. After 35 d of RAC, tenderloin weight was 0.07 kg heavier (P < 0.001) and percentage of HCW was 0.11% greater (P < 0.001) than POS (Table 9). Sirloin weight was increased (P = 0.030) 0.07 kg compared with NEG weight of 0.79 kg. Both sirloin weight and percentage of HCW increased linearly (P < 0.001) as RAC duration increased.
Advantages in wholesale, trimmed, and boneless cuts of pigs fed RAC at various doses have been reported on nearly every portion of the carcass. Stites et al. (1991) reported a linear increase in wholesale ham weights, trimmed wholesale hams, trimmed wholesale loins, and boneless wholesale hams when RAC was increased from 0 to 20 mg/kg. Uttaro et al. (1993) reported heavier trimmed ham weights and heavier trimmed loin weights of pigs fed RAC at 20 mg/kg when compared with controls. Kutzler et al. (2010) reported heavier wholesale hams and loins of pigs fed 10 mg/kg of RAC compared with controls. Carr et al. (2005a) reported heavier whole hams, picnics, Boston butts, skin-on bellies, and loins of pigs fed 10 mg/kg of RAC compared with controls. Boler et al. (2011) reported increases in percentage of HCW for whole ham, trimmed ham, inside ham, outside ham, and the knuckle of pigs fed RAC at 7.4 mg/kg when compared with controls. Fernández-Dueñas et al. (2008) reported whole shoulder weights were a greater percentage of HCW in pigs fed 5.0 mg/kg of RAC when compared with controls.
A smaller RAC dose is required for a response of growth variables than doses required for carcass composition changes (Armstrong et al., 2004). Furthermore, longer RAC durations are required to change carcass composition. Armstrong et al. (2004) reported improvements in ADG and G:F in as little as 6 d of feeding 5 mg/kg of RAC, but required 13 d to observe an improvement in HCW and 27 d at 10 mg/kg of RAC to observe an increase in fat-free lean.
Meat Quality
There were no differences in objective meat color among negative control, positive control, and RAC-fed pigs (Table 10). Objective color of the loin changed as RAC duration increased. Color became darker linearly (P = 0.027), as indicated by decreased Minolta lightness (L*) values (Table 11). This is in contradiction to Armstrong et al. (2004), who saw no difference in Minolta L* values with dosages of 5 and 10 mg/kg of RAC. Minolta a* and b* values decreased linearly (P < 0.01) as RAC duration increased indicating a less red color (a*) and less yellow color (b*; Table 11). Previous literature has also reported significant decreases in a* and b* values with 10 and 20 mg/kg dosages (Aalhus et al., 1990; Uttaro et al., 1993; Carr et al., 2005a). These subtle changes, however, even though statistically significant, may not be visually noticeable (Apple et al., 2007). Subjective marbling score decreased (P = 0.002) 0.49 units from the NEG value of 3.0, whereas extractable lipid decreased (P ≤ 0.05) to 1.81% compared with NEG (2.25%) and POS (2.13%) diets. There was also a linear decrease (P = 0.011) in extractable lipid as RAC duration increased (Table 11). The trends in marbling scores and extractable lipid in the current work are in contradiction with the current literature. A metaanalysis conducted by Apple et al. (2007) indicated no impacts of RAC on marbling scores, and Carr et al. (2005a,b) reported that there were no differences in extractable lipid. In the current study, there were no interactions between chop-aging time and treatment, and thus WBSF and cook loss data were averaged across chop aging day. There were no differences in WBSF or cook loss among RAC, NEG, or POS diets (Table 10). There were no differences in WBSF for pigs fed 0 or 5 mg/kg in a meta-analysis conducted by Apple et al. (2007) or for cook loss among pigs given 0, 5, or 7.4 mg/kg of RAC (Fernández-Dueñas et al., 2008). Limited data are available for extended durations of RAC on meat quality. However, Fernández-Dueñas et al. (2008) reported no differences for any meat quality variables as duration increased from 21 to 28 d. Likewise, Armstrong et al. (2004) reported no detrimental effects to pork quality as RAC duration increased from 6 to 34 d. Therefore, it can safely be concluded that extended periods of RAC feeding do not affect meat quality.
Implications
Overall, RAC administered at 5 and 7.4 mg/kg had greater responses in carcass weight and cut yield than NEG, and had a minimal effect on meat quality. Based on these data, RAC had an advantage in most response variables, regardless of control diet.
LITERATURE CITED
Aalhus, J. L., S. D. Jones, A. L. Schaefer, A. K. W. Tong, W. M. Robertson, J. K. Merrill, and A. C. Murray. 1990. The effect of ractopamine on performance, carcass composition and meat quality of finishing pigs. Can. J. Anim. Sci. 70:943–952.
Apple, J. K., C. V. Maxwell, D. C. Brown, K. G. Friesen, R. E. Musser, Z. B. Johnson, and T. A. Armstrong. 2004. Effects of dietary lysine and energy density on performance and carcass characteristics of finishing pigs fed ractopamine. J. Anim. Sci. 82:3277–3287.
Apple, J. K., P. J. Rincker, F. K. McKeith, S. N. Carr, T. A. Armstrong, and P. D. Matzat. 2007. Review: Meta-analysis of the ractopamine response in finishing swine. Prof. Anim. Sci. 23:179–196.
Armstrong, T. A., D. J. Ivers, J. R. Wagner, D. B. Anderson, W. C. Weldon, and E. P. Berg. 2004. The effect of dietary ractopamine concentration and duration of feeding on growth performance, carcass characteristics, and meat quality of finishing pigs. J. Anim. Sci. 82:3245–3253.
Bark, L. J., T. S. Stahly, G. L. Cromwell, and J. Miyat. 1992. Influence of genetic capacity for lean tissue growth on rate and efficiency of tissue accretion in pigs fed ractopamine. J. Anim. Sci. 70:3391–3400.
Boler, D. D., S. F. Holmer, D. A. Duncan, S. N. Carr, M. J. Ritter, C. R. Stites, D. B. Petry, R. B. Hinson, G. L. Allee, F. K. McKeith, and J. Killefer. 2011. Fresh meat and further processing characteristics of ham muscles from finishing pigs fed ractopamine hydrochloride. J. Anim. Sci. 89:210–220.
Carr, S. N., D. N. Hamilton, K. D. Miller, A. L. Schroeder, D. Fernández-Dueñas, J. Killefer, M. Ellis, and F. K. McKeith. 2009. The effect of ractopamine hydrochloride (Paylean®) on lean carcass yields and pork quality characteristics of heavy pigs fed normal and amino acid fortified diets. Meat Sci. 81:533–539.
Carr, S. N., D. J. Ivers, D. B. Anderson, D. J. Jones, D. H. Mowrey, M. B. England, J. Killefer, P. J. Rincker, and F. K. McKeith. 2005a. The effects of ractopamine hydrochloride on lean carcass yields and pork quality characteristics. J. Anim. Sci. 83:2886–2893.
Carr, S. N., P. J. Rincker, J. Killefer, D. H. Baker, M. Ellis, and F. K. McKeith. 2005b. Effects of different cereal grains and ractopamine hydrochloride on performance, carcass characteristics, and fat quality in late-finishing pigs. J. Anim. Sci. 83:223–230.
Crome, P. K., F. K. McKeith, T. R. Carr, D. J. Jones, D. H. Mowrey, and J. E. Cannon. 1996. Effect of ractopamine on growth performance, carcass composition, and cutting yields of pigs slaughtered at 107 and 125 kilograms. J. Anim. Sci. 74:709– 716.
Dunshea, F. R., R. H. King, and R. G. Campbell. 1993. Interrelationships between dietary protein and ractopamine on protein and lipid deposition in finishing gilts. J. Anim. Sci. 71:2931–2941.
Edmonds, M. S., and D. H. Baker. 2010. Effect of dietary protein and lysine fluctuations in the absence and presence of ractopamine on performance and carcass quality of late-finishing pigs. J. Anim. Sci. 88:604–611.
FASS (Federation of Animal Science Societies). 2010. Guide for the Care and Use of Agricultural Animals in Research and Teaching. 3rd ed. Accessed Sep. 1, 2010. http://www.fass.org/docs/ agguide3rd/Ag_Guide_3rd_ed.pdf.
Fernández-Dueñas, D. M., A. J. Myers, S. M. Scramlin, C. W. Parks, S. N. Carr, J. Killefer, and F. K. McKeith. 2008. Carcass, meat quality, and sensory characteristics of heavy body weight pigs fed ractopamine hydrochloride (Paylean). J. Anim. Sci. 86:3544–3550.
IMPS. 1996. Institutional Meat Purchase Specification. USDA marketing and regulatory programs. Agricultural Marketing Service, Livestock and Seed Program, Washington, DC.Kutzler, L. W., C. M. Peterson, M. Ellis, S. N. Carr, M. J. Ritter, T. A. Armstrong, F. K. McKeith, and J. Killefer. 2010. Ractopamine (Paylean) response in heavy-weight finishing pigs. Prof. Anim. Sci. 26:243–249.
Mimbs, K. J., T. D. Pringle, M. J. Azain, S. A. Meers, and T. A. Armstrong. 2005. Effects of ractopamine on performance and composition of pigs phenotypically sorted into fat and lean groups. J. Anim. Sci. 83:1361–1369.
Nakai, H., F. Saito, T. Ikeda, S. Ando, and A. Komatsu. 1975. Standard models of pork colour. Bull. Natl. Inst. Anim. Ind. 29:69–74.
NAMP. 1997. Meat Buyers Guide. North Am. Meat Processors Assoc., Reston, VA.
Novakofski, J., S. Park, P. J. Bechtel, and F. K. McKeith. 1989. Composition of cooked pork chops: Effect of removing subcutaneous fat before cooking. J. Food Sci. 54:15–17.
NPPC. 1991. Procedures to Evaluate Market Hogs. 3rd ed. Natl. Pork Prod. Counc., Des Moines, IA. NPPC. 1999. Pork Quality Standards. Natl. Pork Prod. Counc., Des Moines, IA.
NRC. 1998. Nutrient Requirements of Swine. 10th ed. Natl. Acad. Press, Washington, DC.
Stites, C. R., F. K. McKeith, S. D. Singh, P. J. Bechtel, D. H. Mowrey, and D. J. Jones. 1991. The effect of ractopamine hydrochloride on the carcass cutting yields of finishing swine. J. Anim. Sci. 69:3094–3101.
Uttaro, B. E., R. O. Ball, P. Dick, W. Rae, G. Vessie, and L. E. Jeremiah. 1993. Effect of ractopamine and sex on growth, carcass characteristics, processing yield, and meat quality characteristics of crossbred swine. J. Anim. Sci. 71:2439–2449.
Watkins, L. E., D. J. Jones, D. H. Mowrey, D. B. Anderson, and E. L. Veenhuizen. 1990. The effect of various levels of ractopamine hydrochloride on the performance and carcass characteristics of finishing swine. J. Anim. Sci. 68:3588–3595.
Webster, M. J., R. D. Goodband, M. D. Tokach, J. L. Nelssen, S. S. Dritz, J. A. Unruh, K. R. Brown, D. E. Real, J. M. Derouchey, J. C. Woodworth, C. N. Groesbeck, and T. A. Marsteller. 2007. Interactive effects between ractopamine hydrochloride and dietary lysine on finishing pig growth performance, carcass characteristics, pork quality, and tissue accretion. Prof. Anim. Sci. 23:597–611.
Williams, N. H., T. R. Cline, A. P. Schinckel, and D. J. Jones. 1994. The impact of ractopamine, energy intake, and dietary fat on finisher pig growth performance and carcass merit. J. Anim. Sci. 72:3152–3162.
Witte, D. P., M. Ellis, F. K. McKeith, and E. R. Wilson. 2000. Effect of dietary lysine level and environmental temperature during the finishing phase on the intramuscular fat content of pork. J. Anim. Sci. 78:1272–1276.


.jpg&w=3840&q=75)