Grouping Strategies for Feeding Lactacting Dairy Cattle
Published: July 29, 2013
By: Victor Cabrera (University of Wisconsin-Madison)
Introduction
Dairy farmers might be over-feeding a large proportion of lactating cows when they feed the same ration to a large group of animals. Diets are normally formulated to provide enough nutrients to the most productive animals, which in turn gives extra nutrients to the less productive animals. Therefore, splitting lactating cows in smaller groups and offering group-specific feeding rations provides more precise nutrient requirements, increases herd's income overfeed cost, and decreases nutrient excretion to the environment. Depending on the farm facilities and extra management costs, considering additional grouping for feeding purposes could be a profitable decision in modern dairy farming.
Strategies for Grouping Lactating Cows
The decision to increase the number of groups within a farm, formulate more rations, and offer group specific diets will depend on the individual cow's nutrient requirement expressed as Mcal/kg of Dry Matter(DM) and % of CP of DM (McGilliard et al., 1983), the number of lactating animals, and the farm's capacity of handle several feeding groups.
Individual Cow Nutrient Requirements and Dry Matter Intake
Following are some principles and equations that are used to calculate nutrient requirements of lactating dairy cattle:
Net Energy (NE)
Total NE (NEtotal) of a lactating cow is the sum of the NE required for maintenance (NEmaintenance) and the NE required for milk production (NEmilk):
NEtotal (Mcal) = NEmaintenance + NEmilk [1]
The NEmaintenance is a function of animal's body weight (BW in kg), NRC (2001):
NEmaintenance (Mcal) = 0.079 x BW0.75 [2]
The NEmilk depends on the cow's milk (kg) and fat production, NRC (2001):
NEmilk (Mcal) = Milk x (0.36 + 0.0969 *(Fat %)) [3]
then, the NE per kg of dry matter(DM) is the estimated NEtotal cow's with respect to the cow's dry matter intake (DMI):
NE (Mcal/kg DM) = NEtotal /DMI [4]
Crude Protein (CP)
Total CP (CPtotal) is also the sum of the CP required for maintenance (CPmaintenance) and the CP required for milk production (CPmilk):
CPtotal (g) = CPmaintenance + CPmilk [5]
The CPmaintenance is a function of animal's BW, McGilliard et al. (1983):
CPmaintenance (g) = 104.78+0.73 x BW - 0.00015432 x BW2 [6]
The CPmilk depends on the cow's milk (kg) and fat production, McGilliard et al. (1983):
CPmilk (g) = Milk x (4586 + 1036 *(Fat %))/100 [7]
then, the % CP per kg of DM is calculated using the estimated cow's DMI:
% CP = (CPtotal /1000) /DMI [8]
Body Weight (BW)
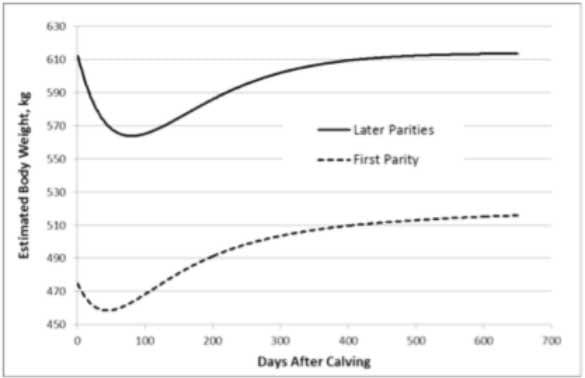
Individual cow's BW could be either measured or estimated. If estimated, individual cow BW could be expressed as a function of cow's parity, days after calving (DIM), and an average BW of cohorts by parity using the Korver function (Korver et al., 1985) fitted to the NRC (2001) BW function (Figure 1).
Figure 1. Estimated cow's body weight (BW, kg) by days after calving (DIM) for an average cow with 500 kg BW in first parity and 600 kg BW in later parities.
Dry MatterIntake (DMI)
Dry matter intake could be calculated as a function of DIM, BW, and 4% fat corrected milk (FCM) according to NRC (2001):
DMI = (0.372 x 4% FCM + 0.0968 x BW0.75) x (1 – e (- 0.192 x ((DIM/7)+3.67) ) [9]
where 4% FCM is a function of the milk fat content with respect to the corrected fat level (4%), NRC (2001):
4% FCM = 0.4 x Milk + 15 x (Fat %/100) x Milk [10]
Nutrient Requirements for a Group of Cows
A lead factor (multiplicative factor) based on the 83 rd percentile method (Stallings and McGilliard, 1984) to adjust nutrient requirements to the 83 rd percentile (mean plus one standard deviation) could be used to formulate NE and CP requirements for a particular group of lactating cows.
NEgroup (Mcal/kg DM) = 83rd Percentile (NEgroup_cows ) [11]
CPgroup (% DM) = 83 rd Percentile (CPgroup_cows ) [12]
Maximum Number of Groups of Lactating Cows
The maximum number of groups of cows fed different rations will be dictated by the dairy farm facilities and management. Nonetheless, it seems that there would be little gain for feeding more than 4 different diets (McGilliard et al.,1983; St. Pierre and Thraen, 1999). The decision could then be confined to manage 2, 3, or 4 lactating cow groups for feeding purposes, in addition to the no grouping option, which formulates one ration for all lactating cows.
Criteria for Grouping Lactating Cows for Feeding Purposes
Although there are several different criteria to formulate diets and to group cows for feeding purposes, 4 criteria are believed to be the critical (McGilliard et al., 1983): 1) days after calving (DIM), 2) fat corrected milk (FCM), 3) dairy merit (FCM and BW), and 4) cluster (combined NE and CP requirements).
Days after calving (DIM)
This criterion consists simply on grouping cows according to their stage of lactation (e.g., early, mid, and late lactation animals). This is popular among farmers as it is easy to manage, coincides or help with other management practices (i.e.,reproductive management), and seems intuitive as cows in similar lactation stages would have similar nutrient requirements.
Fat corrected milk (FCM)
This criterion prescribes that cows should be grouped based on their level of production measured as FCM (i.e., 4% FCM). This is also popular among dairy producers. It seems reasonable and logic to assume that cows with similar productivity should have similar nutrient requirements and should belong to the same group and feeding ration.
Dairy merit
Dairy merit by definition (McGilliard et al., 1983) is a function of both the level of production and BW. It is defined as FCM/BW0.75. This criterion might out perform DIM and FCM criteria (McGilliard et al., 1983).
Cluster
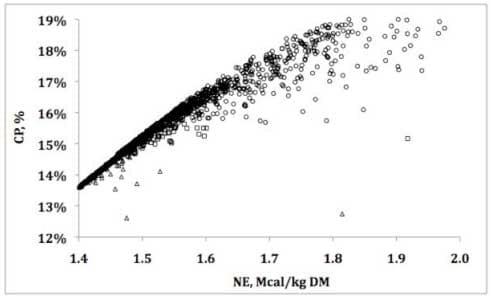
Cluster criterion that is a function of NE and CP requirements seems to be the most efficient method for grouping cows (McGilliard et al., 1983; St-Pierre and Thraen, 1999). This method consists of using clusters of cows with similar requirements of NE and CP within a feeding group. Cows are grouped depending on the physical distance existing between observations in a space defined by NE and CP requirements as illustrated in Figure 2.
Figure 2. Illustration of estimated NE and CP requirements on a 1,800-cow herd. Six hundred cows (circles) belong to a first feeding group, 600 hundred cows (squares) belong to second feeding group, and 600 hundred cows (triangles) belong to third feeding group.
Optimize the Cows Belonging to a Group to Maximize the Income over Feed Cost (Max IOFC)
Price NE and CP
The price of NE ($/Mcal) and CP ($/kg) can be deducted by using referee feeds such as corn and soybean meal (SBM). This calculation could be done collecting information on the NE (Mcal/kg), CP (%), and price ($/kg) of corn and SBM and solving Equations 13 and 14 simultaneously:
Corn % CP + Corn Mcal NE = $/kg Corn Price [13]
SBM % CP + SBM Mcal NE = $/kg SBM Price [14]
Cow Assignment to Feeding Groups
Cows belonging to particular groups could be found by an iterative process of searching for a global maximum IOFC when assigning cows to pre-defined number and size groups on a farm. First, the possible number of groups and the size of each group are defined. Then, the aggregated cow-specific difference between milk sales and feed costs (IOFC) is repeatedly calculated until the Max IOFC is found:
Max (IOFC) = ΣGgroup=1 (IOFC) group) [15]
where IOFCgroup =( Milkgroup)(MilkPrice) – (FeedCost group ),
FeedCost group = (83%tileCPgroup ) (CPPrice)) + )83%tileNEl group ) (NEl Price),
IOFC = Income over Feed Cost, and G = total number of groups: 2, 3, or 4.
Additional Costs and Benefits of Grouping Feeding Strategies
Management costs
Increasing the number of feeding groups in a dairy farm will likely add costs to the farm because of additional labor needed to formulate, prepare, and feed more rations. This cost should be estimated and provided by the farmer because this is a highly farm specific figure.
Milk depression cost
Cows that are moved from one group to another group and from one ration to another ration could likely suffer milk depression for a period of time after the movement happens. This milk depression might occur because of social interaction adjustments or because ofreceiving a lower nutritive diet due to the re-grouping.
Savings because additional grouping
Some costs might also be avoided when increasing the number of feeding groups. An example is the costs of feeding additives, which normally are targeted for a specific group of cows (e.g., high producing, early lactation cows). Therefore, having additional feeding groups would save these costs for other feeding groups.
Overall Net Return of Grouping Strategies for Feeding
The overall Net Return could then be defined as the economic difference of the maximum IOFC of the optimal grouping criterion forthe farm-defined number of feeding groups with the optimal group cow assignment plus savings because of grouping (if any) minus farm-expected additional management costs (if any) and minus farm-expected milk depression because of grouping (if any), Equation 16.
Net Return = Max(IOFC) + Savings – Management – Milk Depression [16]
Perform Analyses ofImproved Grouping Strategies
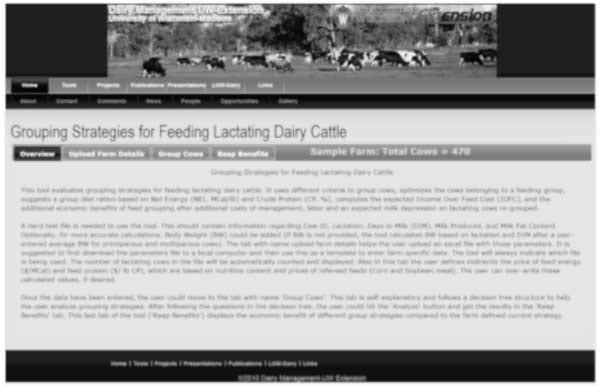
The proposed methodology above discussed has been implemented on an online tool in the Wisconsin Dairy management Web page:
DairyMGT.info: Tools: Grouping Strategies for Feeding Lactating Dairy Cattle.
This decision support system is freely and openly available to anyone who would like to use it. After login in the tool, the user follows an intuitive menu that allows customizing the analysis to any particular dairy herd system.
Figure 3. Screenshot of decision support system: Grouping Strategiesfor Feeding Lactating Dairy Cattle available at DairyMGT.info: Tools.
Get the farm data forthe online tool
Farm time specific dataset should contain the following minimum fields of information for each lactating cow in the herd: 1) cow identification, 2) parity, 3) days after calving (DIM), 4) milk production, and 5) milk fat content. Optionally, for greater precision, if available, cow's BW could also be used in the dataset. If cow's BW is not available, an average figure for primiparous and for multiparous would suffice. In addition to this dataset, the user needs to define eitherthe price and the CP and NEL content of corn and SBM orthe value of CP ($/lb) and NE ($/Mcal); the price of milk ($/cwt); and farm-specific grouping strategies for feeding lactating dairy cattle. Grouping strategies are discussed in greater detail below.
Grouping strategies forfeeding in the online tool
Lactating cows in a farm might or might not be currently divided in groups for feeding purposes. Whether they are grouped or not, the farm could or could not have the ability to still increase the number of feeding groups. More specifically:
1. If lactating cows are divided in groups for feeding purposes and:
a. There is no capability for doing more groups, then there are opportunities for improving grouping decisions by any or various factors listed below:i. Select the right group criterionii. Adjust diets on each one of the groupsiii. Optimize animals belonging to each groupb. There is capability for doing more groups, then there are opportunities for improving grouping decisions by any or various factors listed below:i. Select the right number of groupsii. Select the right group criterioniii. Adjust diets on each one of the groupsi.v Optimize animals belonging to each group
2. If lactating cows are not divided in groups for feeding purposes, but the farm has capabilities of doing groups, there are opportunities forimproving grouping decisions by any or various factors listed below:
i. Select the right number of groups (2, 3, or 4 groups)ii. Select the right group criterioniii. Adjust diets on each one of the groupsiv. Optimize animals belonging to each group
The online tool presents a decision tree diagram with a set of questions to capture current farm situation, which then is used to analyze possible grouping strategies forfeeding lactating dairy cattle.
Illustration of Grouping Strategies for Feeding Lactating Dairy Cattle
Analyses from dairy farm records
Test records from a number of Wisconsin dairy farms (n = 30) were collected and adjusted to datasets consisting of cow identification, lactation, days in milk, milk production, and milk butterfat. Each farm was then analyzed using the online tool: Grouping strategies for feeding lactating dairy cattle.
The aim of this exercise was to demonstrate the value of grouping compared to no grouping without knowing studied farms' actual feeding strategies. Therefore, same procedure and assumptions were followed on each analyzed farm:
• Comparison of no grouping versus 3 samesize groups
• Prices at $15.89/cwt milk, $0.14337/lb CP, and $0.1174/Mcal NEl
• Body weight at 1,100 lb for primiparous and 1,300 lb for multiparous
• Requirements of CP and NEl at the 83 rd percentile level (mean + 1 SD)
• Cluster grouping criterion
• Prices at $15.89/cwt milk, $0.14337/lb CP, and $0.1174/Mcal NEl
• Body weight at 1,100 lb for primiparous and 1,300 lb for multiparous
• Requirements of CP and NEl at the 83 rd percentile level (mean + 1 SD)
• Cluster grouping criterion
Evaluations clearly and consistently demonstrated that the income overfeed cost (IOFC) in all analyzed farms was greater for the strategy using 3 feeding groups than the no groping strategy (Table 1).
Table 1. Comparison of income overfeed cost (IOFC) of no grouping versus 3 same-size feeding groups for Wisconsin dairy farms assessed by the tool: Grouping strategies for feeding lactating dairy cattle.
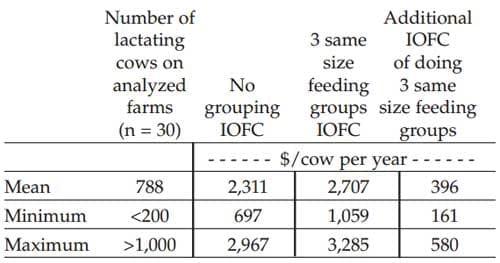
The analysis indicated that farms could realize between $161 and $580/cow per year(mean = $396) of additional IOFC by switching from no grouping to 3 same-size feeding groups using the cluster criterion for grouping. These values represented an increase of between 7 and 52% of farm calculated IOFC. We can conclude that grouping would have important economic implications in farm profitability.
However, performing grouping and feeding different rations to the groups could have additional costs and possible economic losses. After assuming reasonable costs of management, labor, and machinery and reasonable expected milk depression on those cows affected by the grouping changes, the net return of grouping was still much greater than the no groping option: The additional IOFC estimated in Table 1 decreased only between 9 and 25% for these scenarios and therefore 3 same-size feeding groups was still much more profitable than the no grouping option.
Analyses with farmers input
Two commercial dairy farms in Wisconsin were visited with the objective to discuss and demonstrate grouping strategies on those farms. The analysis was performed with latest farm records and farmer's input and decisions to customize the tool to their own conditions, including prices, estimated body weight, and current grouping feeding strategies. Importantly, the farmer decided which potential grouping strategies could be made on the farm. Brief summaries of these visits are described below.
In the first farm the final strategy was to switch from currently doing 3 feeding groups underthe DIM criterion to 4 groups underthe cluster criterion. After discounting estimated additional costs and potential milk depression,results indicated that adding one more feeding group and using the cluster criterion would represent an additional net return of $106/cow per year on this farm.
In the second farm, a complete analysis was not possible because the farm was already doing complex grouping strategies beyond the capabilities of the online tool. This farm had in place 4 feeding groups resulting of the intersection of dividing lactating cows by parity (first and later lactations) and by pregnancy status (non-pregnant and pregnant). Nonetheless, the farmer was interested in exploring even more groups. The farm had the managerial and physical capabilities to handle 4 more feeding groups and the farmer was interested in predicting the economic impacts of formulating 4 additional diets to take full advantage of the 8 available pens in the farm. Important in this farm was the fact of keeping distinctive diets according to lactation and pregnancy status. An undergoing follow up strategy forthis farm is then to analyze further splitting of current groups by considering cow's individual requirements of energy and protein.
Acknowledgement
This project was supported by Agriculture and Food Research Initiative Competitive Grant no. 2011-68004- 30340 from the USDA National Institute of Food and Agriculture.
Thanks are extended to M. Cordoba, J. Guenther, and F. San Emeterio for sharing DHIAfarm testrecords and 2 anonymous dairy producers for providing their data and inputs to perform the illustrations in the last section of this manuscript
References
Korver, S., J. A. M. van Arendonk, and W. J. Koops. 1985. A function forlive-weight change between two calvings in dairy cattle. Anim. Prod. 40:233-241.
McGilliard, M. L., J. M. Swisher, and R. E. James. 1983.Grouping lactating cows by nutritional requirements forfeeding. J. Dairy Sci. 6631084-1093.
NRC. 2001. Nutrientrequirement of dairy cattle. 7th rev. ed. National Research Council, Washington, DC.: National Academy Press.
St. Pierre, N. R., and C. S. Thraen. 1999. Animal grouping strategies, sources of variation, and economic factors affecting nutrient balance on dairy farms. J Anim. Sci. 77:72-83.
Stallings, C. C., and M. L. McGilliard. 1984. Lead factors for total mixed ration formulation. J. Dairy Sci. 67:902-907.
This paper was presented at the Four-State Dairy Nutrition and management Conference, June 13 & 14, 2012, Dubuque, Iowa. Engormix thanks for this huge contribution.
Related topics
Authors:

University of Wisconsin - USA
Recommend
Comment
Share

Would you like to discuss another topic? Create a new post to engage with experts in the community.


You may be interested in
.jpg&w=3840&q=75)
Balchem Animal Nutrition