Introduction
Between 1.5 and 2 million households worldwide are believed to keep tropical marine aquaria and the collection trade which supplies this industry is estimated at US$220-330 million annually (Wabnitz et al., 2003). The majority of these imports are destined for the United States, Europe, and Japan (Chapman et al., 1997). Unlike freshwater aquaria species, where 90% of fish species are farmed, only 100 of the 800 species traded in the marine ornamental industry are captive-bred. The family Pomacentridae, particularly clownfish species of the genus Amphiprion, represents the most important group of captive-bred marine species. Among all species, Amphiprion sp. is the best known to aquarium traders due to its color pattern, interesting behavior, and robustness. From 1997 to 2002, A. ocellaris was the most common species of marine ornamental fish and made up 15.6% of the total number exported worldwide and over 25% into European countries (Wabnitz et al., 2003).
One of the major drivers of growth in the fish-keeping hobby over the last 50 years is the development of commercially available manufactured feed. The acceptance and reliance of the mainstream hobby on manufactured feeds has turned attention to the need to quantify the nutritional requirements of these fish (Sales and Janssens, 2003). The quality of feeds is not only an issue in the day-to-day husbandry of these animals but also in their large scale production. With the intensification of modern ornamental fish production, a supply of nutritionally-balanced and affordable feeds is required. The aquarium industry is relatively small despite its very high value, thus few studies on the nutritional requirements of ornamental fish have been published (Priestley et al., 2006a,b,c). A main problem within the trade is the diversity of fish kept in home aquaria, each with its own nutritional requirements.
Nutrient requirements have often been quantified by dose-response relationships (Elangovan and Shim, 1997; Kruger et al., 2001; Ling et al., 2006) but this approach is time consuming and limited in application. In the following study, an attempt was made to apply a factorial approach for determining feed requirements for ornamental fish such as A. percula. The method itself was successfully applied to determine requirements in farmed fish (Lupatsch et al., 2001; 2003a,b; Lupatsch and Kissil, 2005). The advantage over the more traditional empirical based dose-response methods is that it can be used to describe protein and energy requirements for growing fish throughout the production cycle. Estimations are not necessarily restricted to within the size range of the test species and, so, are applicable to a broad range of fish. Key to achieving this however is establishing the utilization efficiencies and maintenance requirements for protein and energy, an assessment of the whole body composition as a function of fish size, and growth potential of the target species under a given set of culture conditions.
Materials and Methods
Methodology. The premise behind the factorial method is that the requirements for protein and energy can be partitioned into growth and maintenance costs based on the assumption that the two are additive. The requirement for maintenance at a constant temperature is primarily dependent upon body size and proportional to the metabolic body weight in the form of a × W(kg)b , where a is a constant, characteristic of a certain fish species at a set temperature and b is the exponent of the metabolic weight which, in fish, has been determined as b = 0.80 and b = 0.70 for energy and protein, respectively (Lupatsch et al., 2003b; Lupatsch, 2009). The requirement for growth on the other hand is dependent upon the amount and composition of the weight gain. This can be expressed as: energy needs (kJ/day/fish) = a × body weight (kg)0.80 + c × energy gain (kJ), where a × (kg)0.80 = maintenance requirement and c = cost in units of dietary energy to deposit energy as growth. The same approach is used to quantify protein, except for the use of exponent b = 0.70 for metabolic body weight. Protein needs (g/day/fish) = a × body weight (kg)0.70 + c × protein gain (g), where c = cost in units of dietary protein to deposit protein as growth. The significance of this approach is that protein and energy needs are expressed primarily in terms of absolute demand per fish body mass and anticipated weight gain, and only secondarily as a percentage of the feed.
Fish and rearing conditions. Amphiprion percula juveniles were spawned from breeding pairs obtained from the wild, housed in the Centre for Sustainable Aquaculture Research (CSAR), and raised in the recirculation system under controlled conditions. Water temperature was maintained at 27.0°C±0.8 (mean±SD) and salinity was 32.0±0.7 ppt. The light regime of the room was kept at 16L:8D. Fry were separated from the adults after hatching, initially reared on enriched rotifers and Artemia, and after 15 days post-hatch progressively weaned onto a formulated larval feed (52% protein, 12% lipid).
Growth prediction and composition of weight gain. This section describes the methods for historic data obtained by CSAR for clownfish growth prediction and composition of weight gain. The data were utilized to estimate feed requirements described in this current study. To be able to achieve this, the growth potential of clownfish growth was monitored for several batches of fish from 15 days post-hatch (i.e., after the live feed stage) to about 2.5 g. Depending on size, groups of clownfish were kept in 20-l tanks and fed commercially available feeds to supply 52-45% dietary protein and 12% lipid to apparent satiation three times per day. Fish were bulk weighed every 10 to 14 days, and the average daily weight gain during two successive weighings was calculated. The corresponding body weight for the period was the geometric weight of the fish during the weighing period. Thus a data set of n = 29 referring daily weight gain to fish weight at a temperature of 27°C was obtained. In addition, 5 groups of 5-10 equal sized fish representing different weight classes were sampled along this growth period to be analyzed for whole body composition.
Requirement for maintenance. To quantify the requirements of energy and protein for maintenance of A. percula, two growth trials were performed with fish weighing 0.2 g and 1.3 g initially. The experimental system consisted of 12 identical 20-l glass aquaria. The tanks were covered with individual mesh covers to prevent the fish from escaping. Stocking density was 25 fish per aquarium in Trial 1 and 15 fish per aquarium in Trial 2. In each trial, triplicate groups of fish were fed manually at increasing amounts from low to apparent satiation, referred to as maintenance, low, medium, and high (supplied at decreasing levels of apparent satiation). Feed was fed three times a day at the satiation level, decreasing to once daily at the low feeding level to ensure equal distribution of the flakes among the fish. The feed was based on the Aquarian® Marine (closed formula), prepared as dry flakes by MARS Fishcare® and supplied by the WALTHAM® Centre for Pet Nutrition (Leicestershire, UK). The main ingredients include fish and fish derivatives, mollusks and crustaceans, cereals, oils and fats, algae, minerals, and vitamins. Proximate composition of the feed as analyzed was 925 mg dry matter, 394 mg crude protein, 110 mg lipid, and 132 mg ash/g as fed; gross energy was 18.63 kJ/g as fed.
Chemical analyses. Identical analyses were applied for feeds and body homogenates. Dry matter was calculated by weight loss after 24 h drying at 105°C in the oven. Ash was calculated from the weight loss after incineration of the samples for 12 h at 550°C in a muffle furnace. Crude protein was measured using the Kjeldahl technique and multiplying nitrogen by 6.25. Crude lipid was determined after chloroform-methanol extraction. Samples were homogenized with a high speed homogenizer for 5 min and lipid was determined gravimetrically after separation and vacuum drying (Folch et al., 1957). Gross energy content was measured by combustion in a Parr bomb calorimeter (Model 6200) using benzoic acid as the standard.
Definitions and statistical procedures. Specific growth rate (SGR) = 100(Ln final BW - Ln initial BW)/time in days, where BW = body weight in g. Feed conversion ratio (FCR) = feed intake/live wt gain. Feed intake (%/BW/day) = 100(daily feed intake/geometric mean wt), where geometric mean = (initial BW x final BW)0.5.
Linear and non-linear equations were obtained by regression analysis and optimal parameter estimates were obtained with the iterative non-linear least squares algorithm of Levenberg-Marquardt. All statistical analyses were carried out using SigmaPlot 8.0 (SPSS Inc., Chicago, IL, USA). For enhanced clarity the performance parameters in Tables 1 and 2 are presented as average values per treatment (means±SD), whereas all data points in the graphs were used to establish the linear equations.
Results
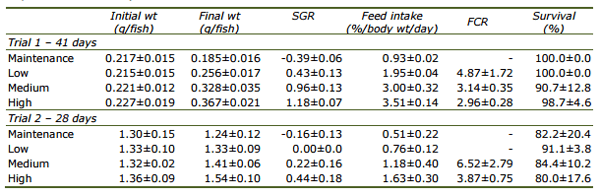
Requirements for maintenance. Weight gain, feed intake, and FCR observed in Trials 1 and 2 are shown in Table 1. As expected, when fed at the highest level, feed intake and specific growth rate were higher in smaller than in larger fish. On the other hand, to satisfy minimum maintenance requirements or to prevent negative growth, the smaller fish needed to consume 1.5% per day per body mass whereas the larger fish needed only 0.80%.
Table 1. Growth performance of Amphiprion percula fed increasing feed levels (mean±SD of triplicate treatments).
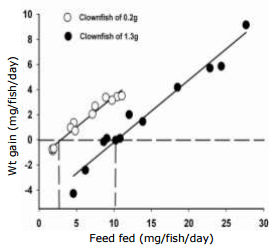
To further examine the feed requirements of clownfish, the relationship between feed intake and weight gain for each trial is illustrated in Fig. 1. The more feed was consumed, the higher was the weight gain. The relationship between x = feed fed (mg) and y = weight gain (mg) per day per fish can be described by linear equations as y = -1.45±0.23 + 0.49±0.03x, r2 = 0.96 for Trial 1 and y = -5.18±0.50 + 0.50±0.03x, r2 = 0.96 for Trial 2. According to these equations, the maintenance requirement (zero growth) of the 0.2 g fish would amount to approximately 3.0 mg feed per day per fish and 1.3 g fish would require 10.4 mg feed per day.
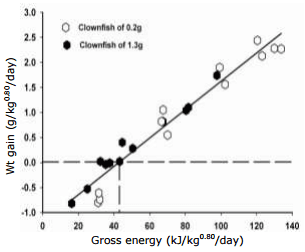
As the energy and protein content of the feed is known, relationships between energy intake and protein intake versus weight gain can be established. In addition, to be able to combine both fish sizes, we used metabolic body weights for energy (kg0.80) and protein (kg0.70) determined for other fin fish (Lupatsch et al., 2001; 2003a; Lupatsch and Kissil, 2005). By expressing gross energy intake (x) and the subsequent weight gain (y) per unit of metabolic body weight (kg0.80), the combined results of the two trials are described by the following linear equation: y = -1.21±0.11 + 0.028±0.001x, r2 = 0.95 (Fig. 2). From this equation and Fig. 2, it can be concluded that the daily requirement for energy at zero growth (y = 0) is approximately 43.2 kJ/kg0.80. The efficiency of dietary energy to deposit growth above maintenance is 0.028, meaning 35.7 kJ (1/0.028) are needed to deposit one g of weight gain.
Fig. 1. Relationship between daily feed intake (mg) and weight gain (mg) of the clownfish, Amphiprion percula, with initial weights of 0.2 g and 1.3 g.
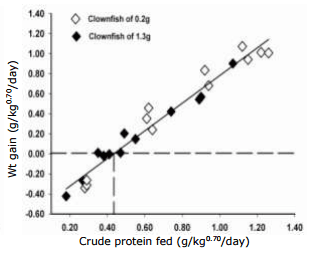
In parallel, the relationship between crude protein fed (x) and weight gained (y), both expressed per unit of metabolic weight (kg0.70), is presented and described by the following equation: protein: y = -0.60±0.04 + 1.38±0.06x, r2 = 0.96 (Fig. 3). From this equation, the daily crude protein needed for maintenance was estimated at 0.43g kg0.70. Here the efficiency of dietary protein to deposit growth above maintenance is 1.38, meaning 0.72 g (1/1.38) are needed to deposit one g of weight gain.
Fig. 2. Daily weight gain of Amphiprion percula fed increasing levels of energy expressed per metabolic body weight of kg0.80 for fish of 0.2 g and 1.3 g combined.
Fig. 3. Daily weight gain of Amphiprion percula fed increasing levels of crude protein expressed per metabolic body weight of kg0.70 for fish of 0.2 g and 1.3 g combined.
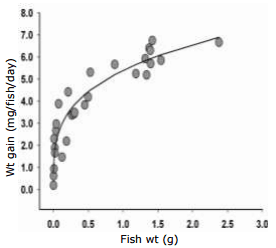
Requirements for growth. The daily weight gain of A. percula at different body sizes is depicted in Fig. 4. In studies with several fish species the best curve fit to describe the daily weight gain (y) dependent on fish weight was obtained using the following common equation: y = a x BW (g)b (Lupatsch et al., 2003b). In similar fashion, the average daily weight gain (n = 29) of clownfish at a temperature of 27°C can be described as follows: y = 5.39±0.16 x BW(g)0.284±0.027, r2 = 0.89, where y = weight gain in mg/fish/day and BW = body weight in g/fish for sizes from 0.02 to 2.4 g. Rearranging this equation, the body weight BWt can be predicted from the initial body weight BW0 after t days as BWt = (BW00.716 + 0.00386 x t)1.397.
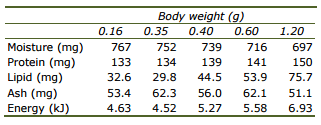
To estimate the energy and protein content of a unit of weight gain, the body composition at selected fish sizes is presented in Table 2. A slight increase in lipid and energy content can be observed in concurrence with decreasing moisture content relative to fish size, whereas protein and ash content stay relatively constant.
Table 2. Whole body content of Amphiprion percula (per g wet weight) at increasing sizes (historic data set at CSAR).
Fig. 4. Daily weight gain (mg) of Amphiprion percula at increasing weights.
Discussion
A parallel can be drawn with commercial culture of food fish as aquaculture is utilizing an increasing variety of fish that show differences with respect to feed requirements and conversion efficiencies.
Growth and composition of weight gain. Some of the differences in feed requirements and conversion efficiencies are due to the growth potential and composition of growth. We assume that fish have a genetically determined asymptotic body size and composition of weight gain, and that the maximum obtainable body size for most ornamental fish is far smaller than for fish grown for human consumption. The growth model set up in the present study (Fig. 4) does not cover the whole life cycle of anemone clownfish and a larger dataset might enhance the prediction. However, it does agree favorably with a number of studies such as Gordon et al. (1998) who carried out several trials raising A. percula larvae post hatch to a size of 0.3 g. It corresponds as well with another study with clownfish (Johnston et al., 2003) that covered the size range between 0.08 g and 0.35 g. According to our equation for predicting growth, A. percula might reach a size of 1.6 g after one year and 4.3 g in 2 years, or at least until the phase where dimorphism sets in as females are dominant and usually grow larger than males. To our knowledge growth has not been monitored for the whole life cycle, however the average size and weight of an adult A. percula is about 60 mm and 10 g respectively; they can typically live to 8-10 years and in extreme cases up to 30 years (Buston and Garcia, 2007).
Because a large proportion of energy and protein consumed by fish is retained as growth, the composition of the gain is an additional factor determining energy and protein requirements. Like other fish, A. percula show a tendency to increase energy density with size or age (Table 2) though whole body protein content is rather constant (Lupatsch et al., 2003b). However, due to a limited data set and for immediate application of estimating feed requirements, an average energy content of 5.39 kJ and protein content of 140 mg per g body mass might be assumed.
Maintenance requirements. Metabolic body weight describes the rate of energy expenditure relative to fish size. As the exponent b for the metabolic body weight for energy and protein have not been determined for A. percula, exponents of b = 0.80 and 0.70, respectively, were used. The exponents for the metabolic weights are quite similar for various fish species as described in Lupatsch (2009), so it is not unreasonable to accept them for A. percula as well. Thus metabolic weight, as opposed to absolute weight, enables us to establish the maintenance requirements of A. percula at different sizes (Figs. 2 and 3), resulting in GEmaint = 43.2 kJ/kg0.80. Johnston et al. (2003) suggested that feeding 0.1 g clownfish 2% of their body mass would supply the requirements just above maintenance. Conversion of their data set reveals that this amounts to GE = 58 kJ/kg0.80, at which level clownfish still show positive growth.
Pannevis and Earle (1994) assessed the maintenance energy requirements of several ornamental species by using the same method of examining the relationship between growth rate and energy intake. Recalculation of their data established that the average daily maintenance requirements for goldfish were GEmaint = 19.2 kJ/kg0.80 and CPmaint = 0.20 g/kg0.70 whereas for neon tetra they amounted to GEmaint = 66.2 kJ/kg0.80 and CPmaint = 0.55 g/kg0.70. Maintenance requirements for goldfish appear to be rather low but possibly reflect the fact that the trials were carried out at a temperature of 20°C whereas for other ornamental species 26°C was used.
Taking into consideration the effect of temperature, energy maintenance requirements of clownfish show similar values to those found for food fish. In a study by Huisman (1976), the daily maintenance requirement was estimated at 66 kJ DE/kg0.80 for carp, Cyprinus carpio, and and 48 kJ DE/kg0.80 for rainbow trout, Oncorhynchus mykiss, at 23°C and 15°C, respectively. Depending on temperature, the maintenance requirement of gilthead sea bream, Sparus aurata, increased from 46.3 kJ DE/kg0.80 at 21°C to 77.0 kJ DE/kg0.80 at 28°C (Lupatsch et al., 2003a). It is quite striking how close these values are among fish species; on the other hand the difference compared to homoeothermic vertebrates is remarkable, as their energy requirements for basal metabolism are up to 10-fold higher, averaging 300 kJ/kg0.75 per day (Kleiber, 1965).
Protein and energy utilization efficiency. Determining the efficiency of gross energy to deposit growth was done by linear regression of weight gain against gross energy intake when both are expressed per metabolic body weight of kg0.80 . Using the slope of 0.028 of the linear equation relating weight gain to energy intake, it can be concluded that 35.7 kJ (1/0.028) of gross energy are needed to deposit one g of weight gain. According to Table 2, the average energy content of 5.39 kJ per g gain was determined. Thus the partial efficiency of energy gain versus gross energy fed is 5.39/35.7 = 0.15. The same calculation can be done for protein. In this case 0.72 g (1/1.38) of crude protein is needed to deposit one g of weight gain. Protein content per g gain is around 140 mg (Table 2). Therefore the partial efficiency of protein gain versus crude protein fed is 0.14/0.72 = 0.19.
The efficiency of energy utilization (i.e., the slope of energy gain as a function of energy intake) for clownfish compared to food fish is rather low. Values range between efficiencies of 0.65, 0.68, and 0.69 for gilthead sea bream, European sea bass, and white grouper, respectively (Lupatsch et al., 2003b). One of the explanations might be that, in the last three species, efficiencies are expressed in units of digestible energy rather than gross energy as done for clownfish. In addition, during the growth trials, whole body composition was analyzed for the food fish, resulting in a more precise assessment. Further, clownfish are slow feeders and despite careful monitoring of feed intake, feed losses might have occurred as a result of leaching and break-up of flakes.
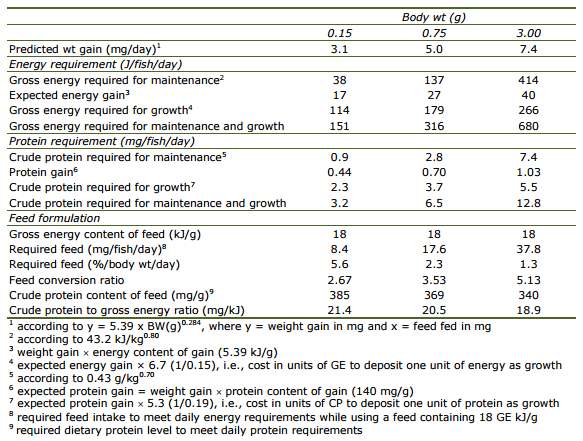
Implications for feed formulation. Using the approach described above, daily requirements for energy and protein in growing A. percula can be calculated for a specific body weight and at any level of growth. The absolute daily energy and protein requirement of clownfish (Table 3) is dependent upon size and anticipated weight gain. The proportion of total dietary energy required for maintenance increases with increasing body weight and decreasing growth rate, influencing the feed conversion ratio. The dietary protein to energy ratio also decreases with increasing fish size and decreasing growth potential. Thus small clownfish of 0.15 g should be fed a 40% protein feed, whereas gradually reducing to a 35% protein feed would suffice for larger fish up to 3 g.
Table 3. Daily energy and protein requirements of anemone clownfish Amphiprion percula at 27°C.
When looking at studies with other ornamentals, the optimal dietary protein content appears quite variable among species. It is difficult to say whether this variation is simply due to methodological differences or the result of real species-specific differences. According to Lochmann and Phillips (1994) protein requirements of goldfish were established at 29% dietary inclusion, whereas Fiogbé and Kestemont (1995) observed that goldfish larvae required 53% crude protein. Studies with the tin foil barb, Barbonymus schwanenfeldii (Elangovan and Shim, 1997) and the swordtail, Xiphophorus hellerii (Kruger et al., 2001) reported protein requirements of 41% and 45% crude protein, respectively. Research carried out by Sealey et al. (2009) indicated that neon tetras of 0.18 g grew best when diets contained at least 45% crude protein whereas Chong et al. (2000) found the optimal dietary protein level to be 45-50% for the discus, Symphysodon aequifasciata. Royes et al. (2006) compared the effects of two protein and lipid levels on growth of two juvenile African cichlids, Pseudotropheus socolofi which is considered to be omnivorous and Haplochromis ahli to be more carnivorous, and hypothesized that the omnivore would have a lower protein requirement than the carnivorous one. The results were inconclusive since no differences were found whether feeding the carnivorous cichlid a 55% protein or a 35% protein feed, whereas the omnivorous fish did better with the high protein/high lipid feed.
One of the factors affecting the optimal dietary protein content may well be the use of fish of different weights, as dietary protein requirements decrease with increasing fish size. A further difference between studies is the choice of feeding rate which could vary from a given proportion of biomass to ad libitum feeding. Therefore, expressing requirements only in terms of a percentage of the diet can be misleading, if the feed intake is not considered. This concept has been confirmed for food fish (Lupatsch, 2009) so the general biological principle should be relevant here as well.
In conclusion, energy and protein requirements of ornamental fish are dependent upon growth potential, composition of weight gain, and demand for maintenance, regardless of whether they are carnivorous or herbivorous, marine or freshwater fish. For pet feed producers this means that they have to formulate a specific feed in combination with a suitable feeding regime. This could be adapted firstly under commercial farming conditions that concentrate on maximum growth rate, and thereafter in public or home aquaria environments where fish are kept for display rather than fast growth.
This article was originally published in The Israeli Journal of Aquaculture - Bamidgeh, IJA_65.2013.917 and it is reproduced with their permission.
References
Buston P.M. and M.B. Garcia, 2007. An extraordinary life span estimate for the clown anemone fish, Amphiprion percula. J. Fish Biol., 70:1710-1719.
Chapman F.A., Fiz-Coy S.A., Thunberg E.M. and C.M. Adams, 1997. United States of America trade in ornamental fish. J. World Aquacult. Soc., 28:1-10.
Chong A.S.C., Hashim R. and A.B. Ali, 2000. Dietary protein requirements for discus (Symphysodon ssp.) Aquacult. Nutr., 6:275-278.
Elangovan A. and K.F. Shim, 1997. Growth response of juvenile Barbodes altus fed isocaloric diets with variable protein levels. Aquaculture, 158:321-329.
Fiogbé E.D. and P. Kestemont, 1995. An assessment of the protein and amino acid requirement in goldfish (Carassius auratus) larvae. J. Appl. Ichthyol., 11:282-289.
Folch J., Lees M. and G.H. Sloane-Stanley, 1957. Simple method for isolation and purification of total lipids from animal tissues. J. Biol. Chem., 226:497-507.
Gordon A.K., Kaiser H., Britz P.J. and T. Hecht, 1998. Effect of feed type and age-atweaning on growth and survival of clownfish Amphiprion percula (Pomacentridae). Aquar. Sci. Conserv., 2:215-226.
Huisman E.A., 1976. Food conversion efficiencies at maintenance and production levels for carp, Cyprinus carpio L., and rainbow trout, Salmo gaidneri. Aquaculture, 9:259-273.
Johnston G., Kaiser H., Hecht T. and L. Oellermann, 2003. Effect of ration size and feeding frequency on growth, size distribution and survival of juvenile clownfish, Amphiprion percula. J. Appl. Ichthyol., 19:40-43.
Kleiber M., 1965. Metabolic body size. pp. 427-435. In: K.L. Blaxter (ed.). Energy Metabolism. Academic Press, London, UK.
Kruger D.P., Britz P.J. and J. Sales, 2001. Influence of varying dietary protein content at three lipid concentrations on growth characteristics of juvenile swordtails (Xiphophorus helleri Heckel 1848). Aquar. Sci. Conserv., 3:265-273.
Ling S., Hashim R., Kolkovski S. and A.C. Shu-Chien, 2006. Effect of varying dietary lipid and protein levels on growth and reproductive performance of female swordtails Xiphophorus helleri. Aquacult. Res., 37:1267-1275.
Lochmann R.T. and H. Phillips, 1994. Dietary protein requirement of juvenile golden shiners (Notemigonus crysoleucas) and goldfish (Carassius auratus) in aquaria. Aquaculture, 128:277-285.
Lupatsch I., 2009. Quantifying nutritional requirements in aquaculture – the factorial approach. pp. 417-439. In: G. Burnell, G. Allan (eds.). New Technologies in Aquaculture: Improving Production Efficiency, Quality and Environmental Management. Woodhead Publ. Ltd., Cambridge, UK. 1191 pp.
Lupatsch I. and G.Wm. Kissil, 2005. Feed formulations based on energy and protein demands in white grouper (Epinephelus aeneus). Aquaculture, 248:83-95.
Lupatsch I., Kissil G.Wm. and D. Sklan, 2001. Optimization of feeding regimes for European sea bass Dicentrarchus labrax: a factorial approach. Aquaculture, 202:289-302.
Lupatsch I., Kissil G.Wm. and D. Sklan, 2003a. Defining energy and protein requirements of gilthead sea bream (Sparus aurata) to optimize feeds and feeding regimes. Isr. J. Aquacult. - Bamidgeh, 55:243-257.
Lupatsch I., Kissil G.Wm. and D. Sklan, 2003b. Comparison of energy and protein efficiency among three fish species: gilthead sea bream (Sparus aurata), European sea bass (Dicentrarchus labrax) and white grouper (Epinephelus aeneus): energy expenditure for protein and lipid deposition. Aquaculture, 225:175-189.
Pannevis M.C. and K.E. Earle, 1994. Maintenance energy requirements of five popular species of ornamental fish. J. Nutr., 124:2616S-2618S.
Priestley S.M., Stevenson A.E. and L.G. Alexander, 2006a. The influence of feeding frequency on growth and body condition of the common gold fish (Carassius auratus). J. Nutr., 136:1979S-1981S.
Priestley S.M., Stevenson A.E. and L.G. Alexander, 2006b. Growth rate and body condition in relation to group size in black widow tetras (Gymnocorymbus ternetzi) and common gold fish (Carassius auratus). J. Nutr., 136:2078S-2080S.
Priestley S.M., Stevenson A.E., Hawthorne A.J. and L.G. Alexander, 2006c. Methods for predicting food allowances from body length in tropical and temperate ornamental fish species. J. Nutr., 136:2081S-2083S.
Royes J.B., Murie D.J. and R. Francis-Floyd, 2006. Effects of varying protein and lipid levels on growth performance and hepatocyte changes in juvenile African cichlids (Pseudotropheus socolofi and Haplochromis ahli). J. World Aquacult. Soc., 37:48-59.
Sales J. and G.P.J. Janssens, 2003. Nutrient requirements of ornamental fish. Aquat. Living Resour., 16:533-540.
Sealey W.M., Barrows F.T., Casten M. and R.W. Hardy, 2009. Dietary protein source and level affects growth in neon tetras. N. Am. J. Aquacult., 71:320-324.
Wabnitz C., Taylor M., Green E. and T. Razak, 2003. From Ocean to Aquarium. UNEP-WCMC, Cambridge, UK.


.jpg&w=3840&q=75)